Annual Hiring Demographic Statistics - 2025
San Francisco Police Department Hiring Process
Overview
The Police Officer application process includes various tests and a background investigation.
Ownership of the hiring process is split between the Department of Human Resources (DHR) which administers all required initial testing for applicants, and the Police Department (SFPD) which conducts all other aspects of the Police Officer hiring process.
Hiring Process
DHR
Online Job Application
Written Test
Physical Ability Test (PAT)
Oral Interview
SFPD
Medical Evaluation
Psychological Evaluation
Polygraph Test
Background Check
Visuals and Data
These visuals show the key indicators for each step of the hiring process including the DHR application process (total applications received), written test, physical ability test, oral interview, as well as candidates entering the SFPD backgrounds investigations process and candidates who were hired into the SFPD Police Academy.
Testing data administered by DHR is maintained by the Public Safety Team while data for candidates entering the backgrounds investigation process and the SFPD Police Academy is maintained internally by SFPD. All data is analyzed and visualized by the SFPD Staffing and Deployment Unit.
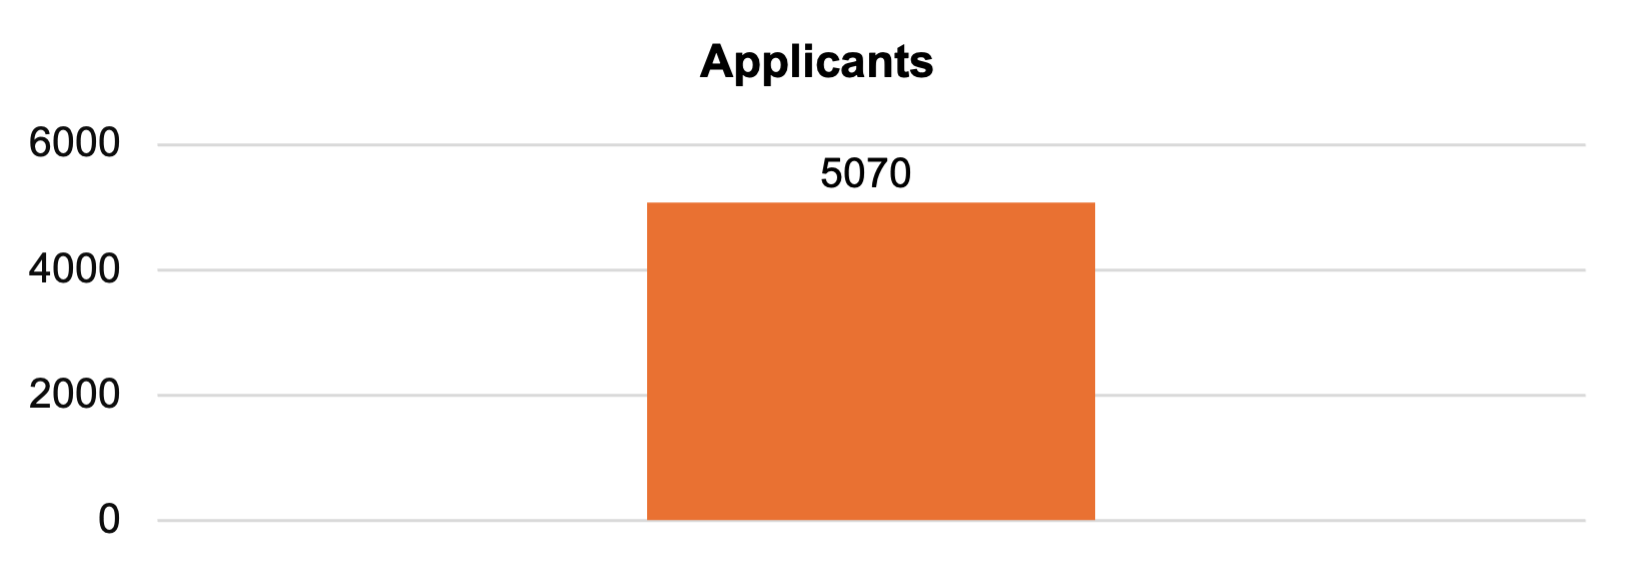
Applicants
| Year | Applicants |
|---|---|
| 2025 | 5070 |
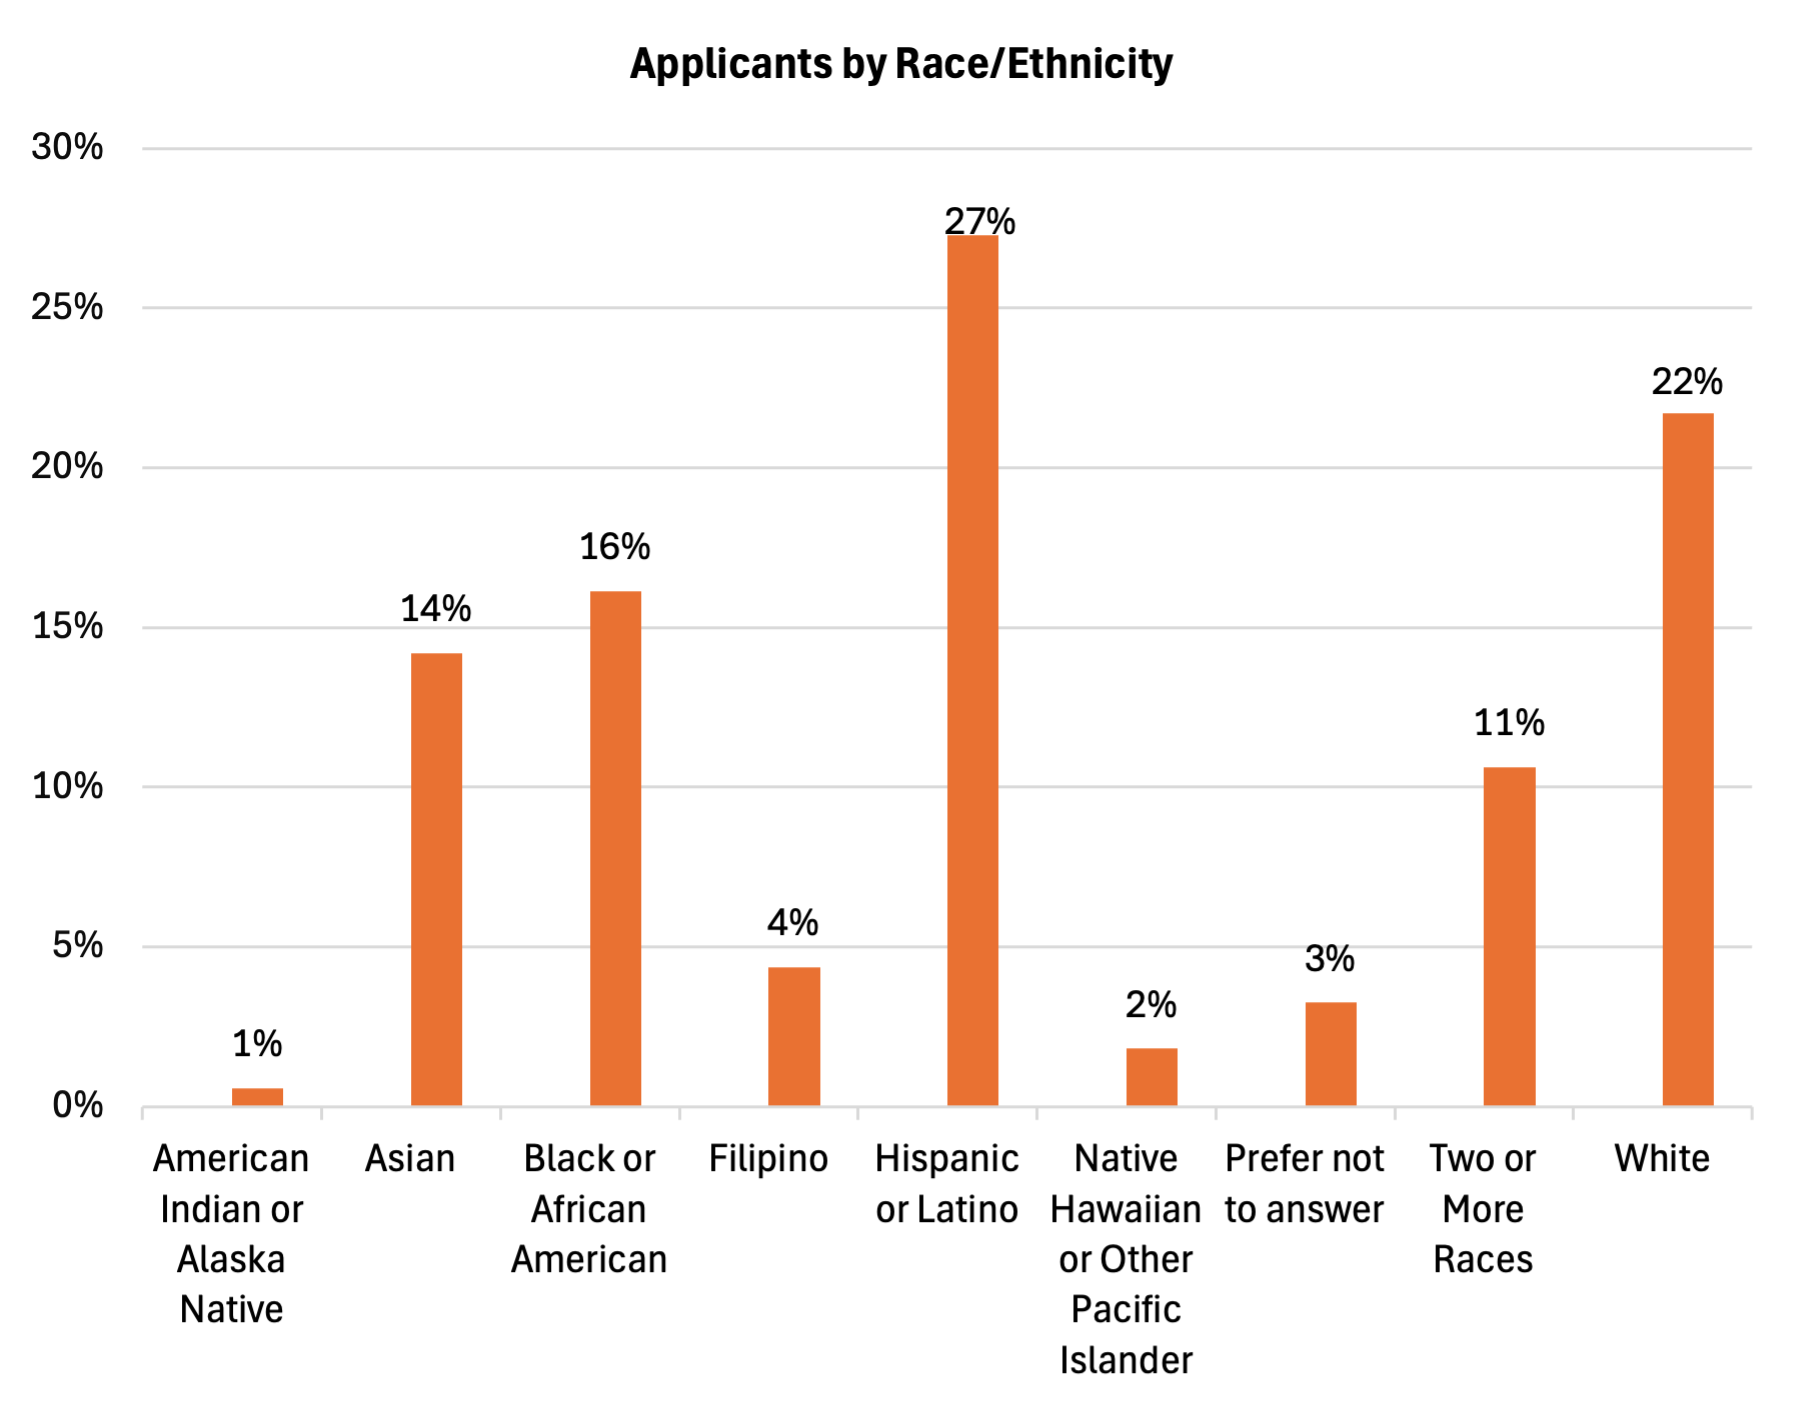
Applicants by Race/Ethnicity
| Race/Ethnicity | Percent |
|---|---|
| American Indian or Alaska Native | 1% |
| Asian | 14% |
| Black or African American | 16% |
| Filipino | 4% |
| Hispanic or Latino | 27% |
| Native Hawaiian or Other Pacific Islander | 2% |
| Prefer not to answer | 3% |
| Two or More Races | 11% |
| White | 22% |
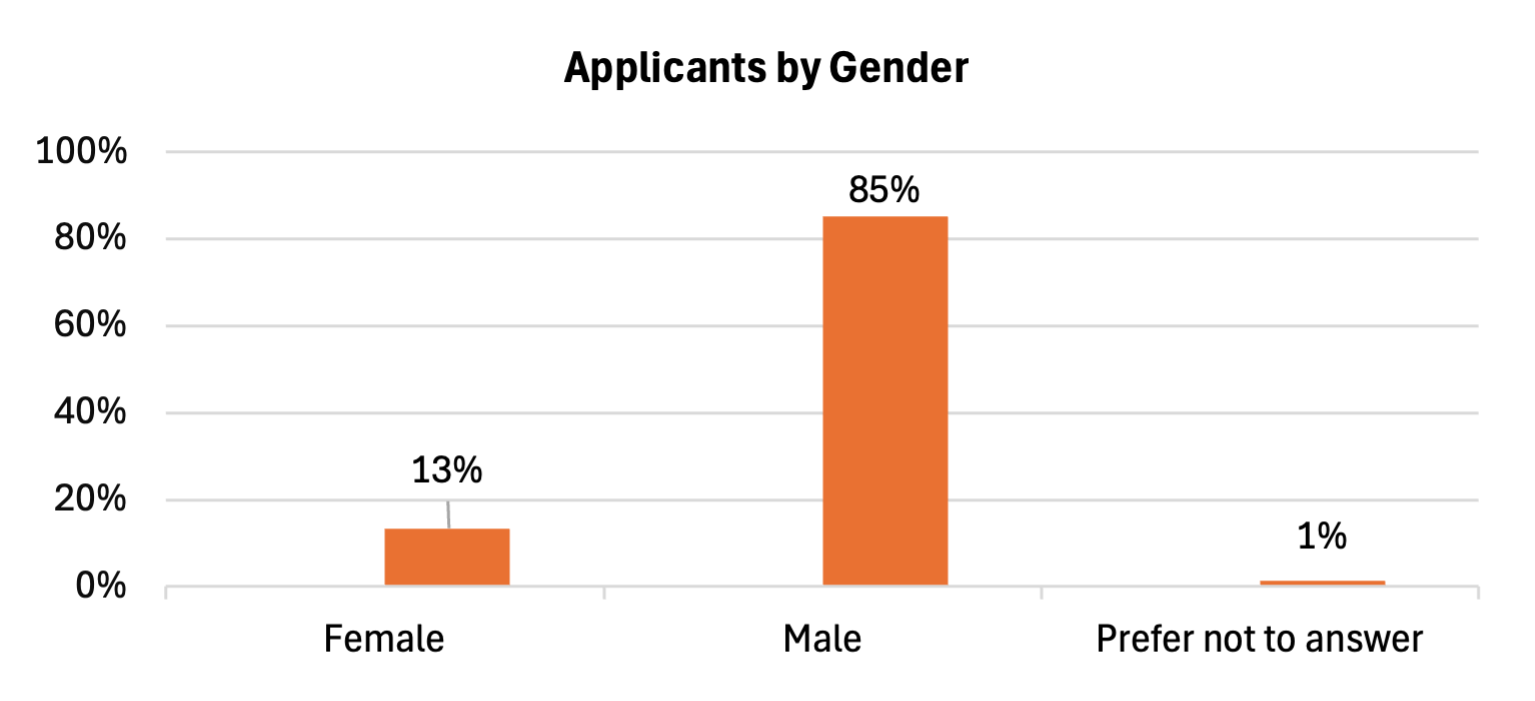
Applicants by Gender
| Gender | Percent |
|---|---|
| Female | 13% |
| Male | 85% |
| Prefer not to answer | 1% |
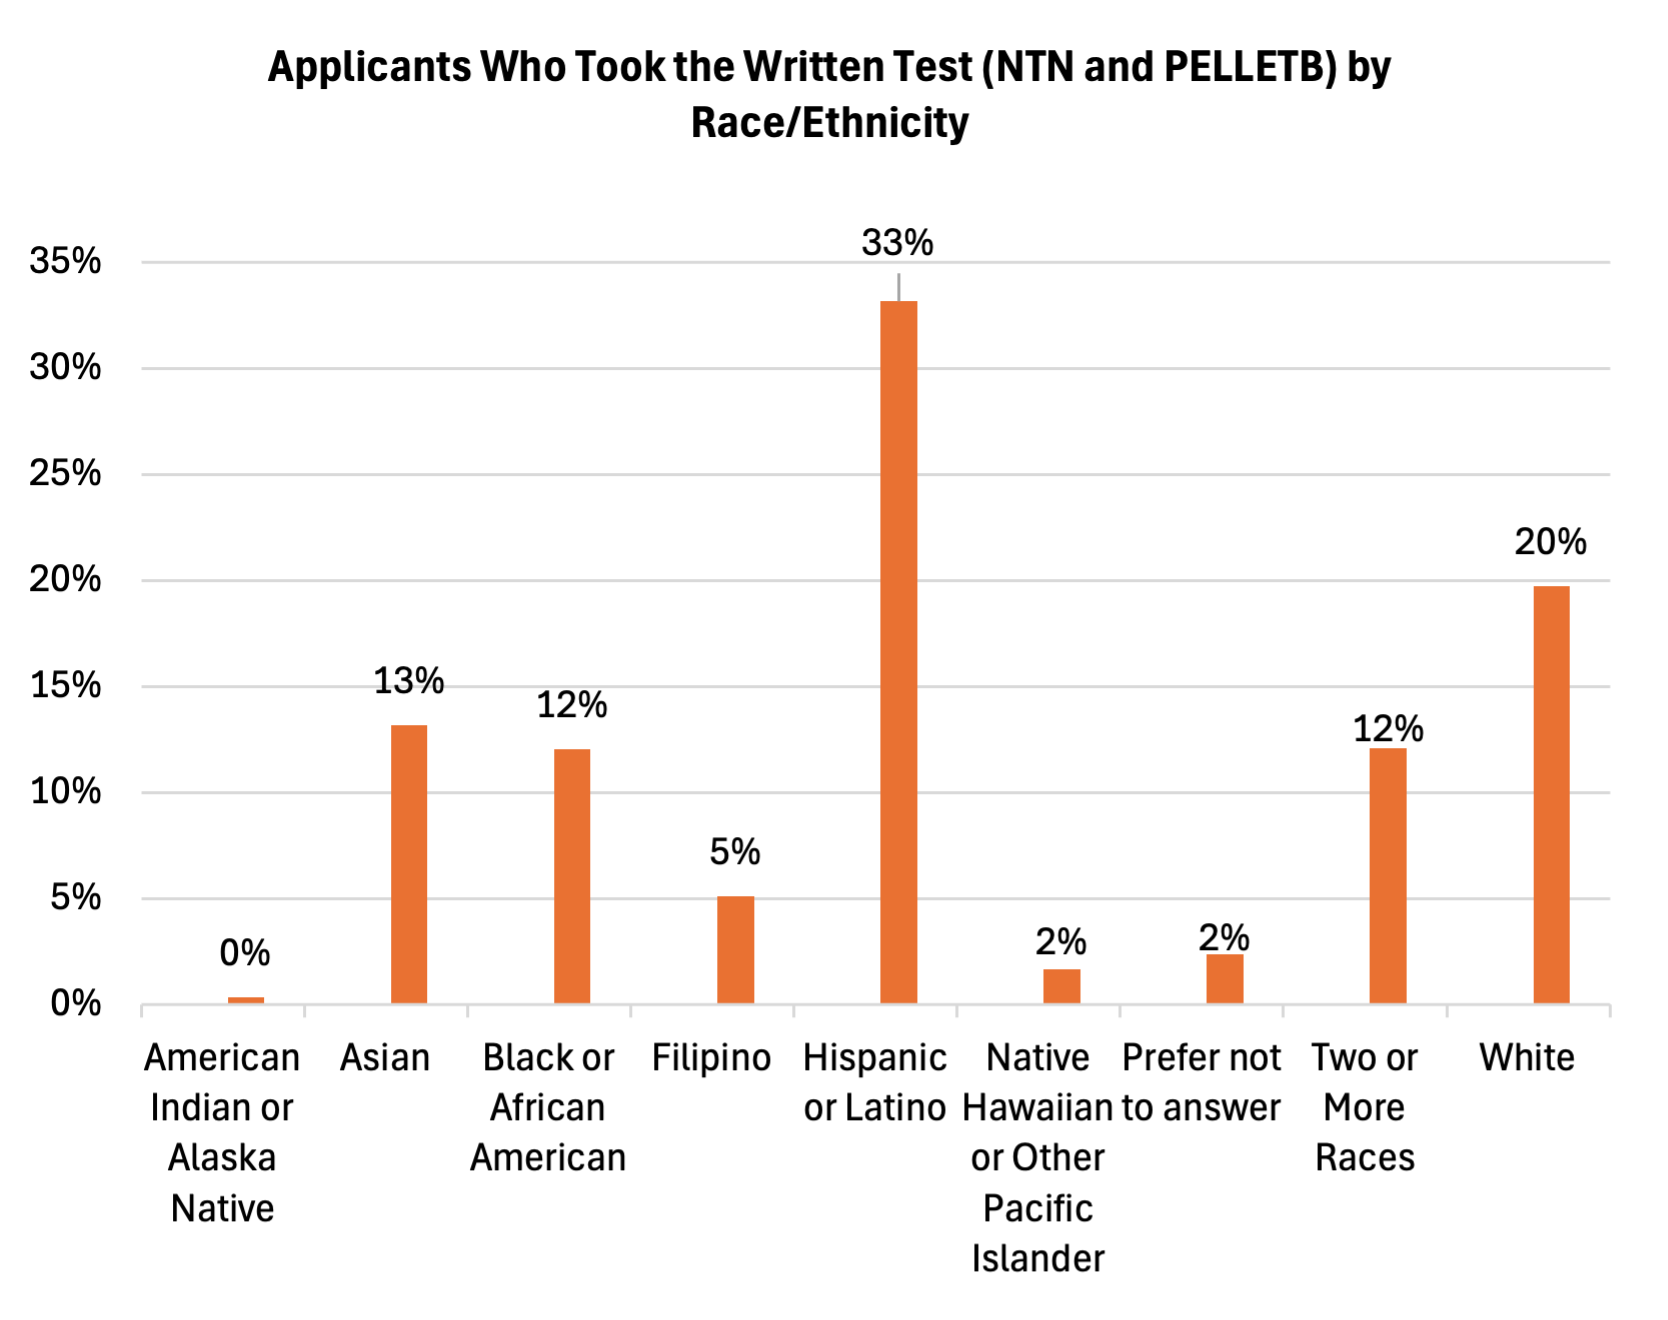
Applicants Who Took the Written Test (NTN and PELLETB) by Race/Ethnicity
| Race/Ethnicity | Percent |
|---|---|
| American Indian or Alaska Native | 0% |
| Asian | 13% |
| Black or African American | 12% |
| Filipino | 5% |
| Hispanic or Latino | 33% |
| Native Hawaiian or Other Pacific Islander | 2% |
| Prefer not to answer | 2% |
| Two or More Races | 12% |
| White | 20% |
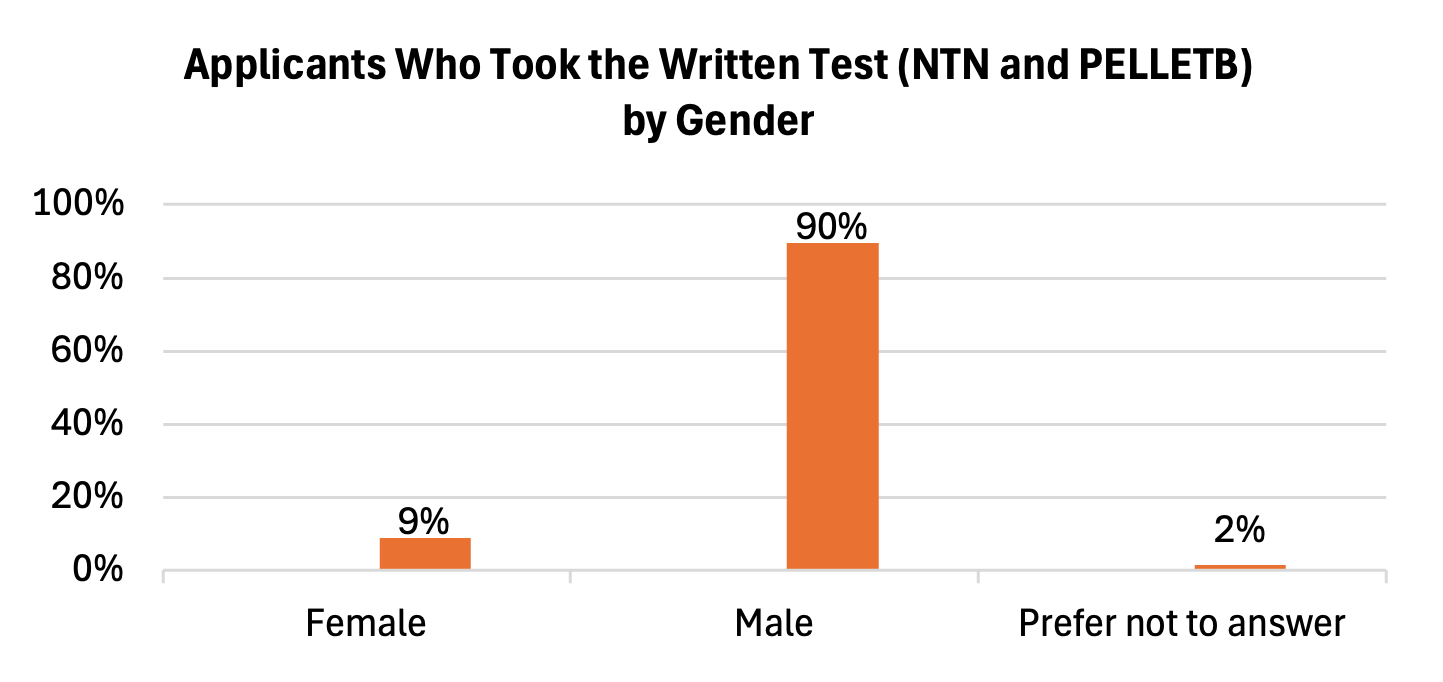
Applicants Who Took the Written Test (NTN and PELLETB) by Gender
| Gender | Percent |
|---|---|
| Female | 9% |
| Male | 90% |
| Prefer not to answer | 2% |
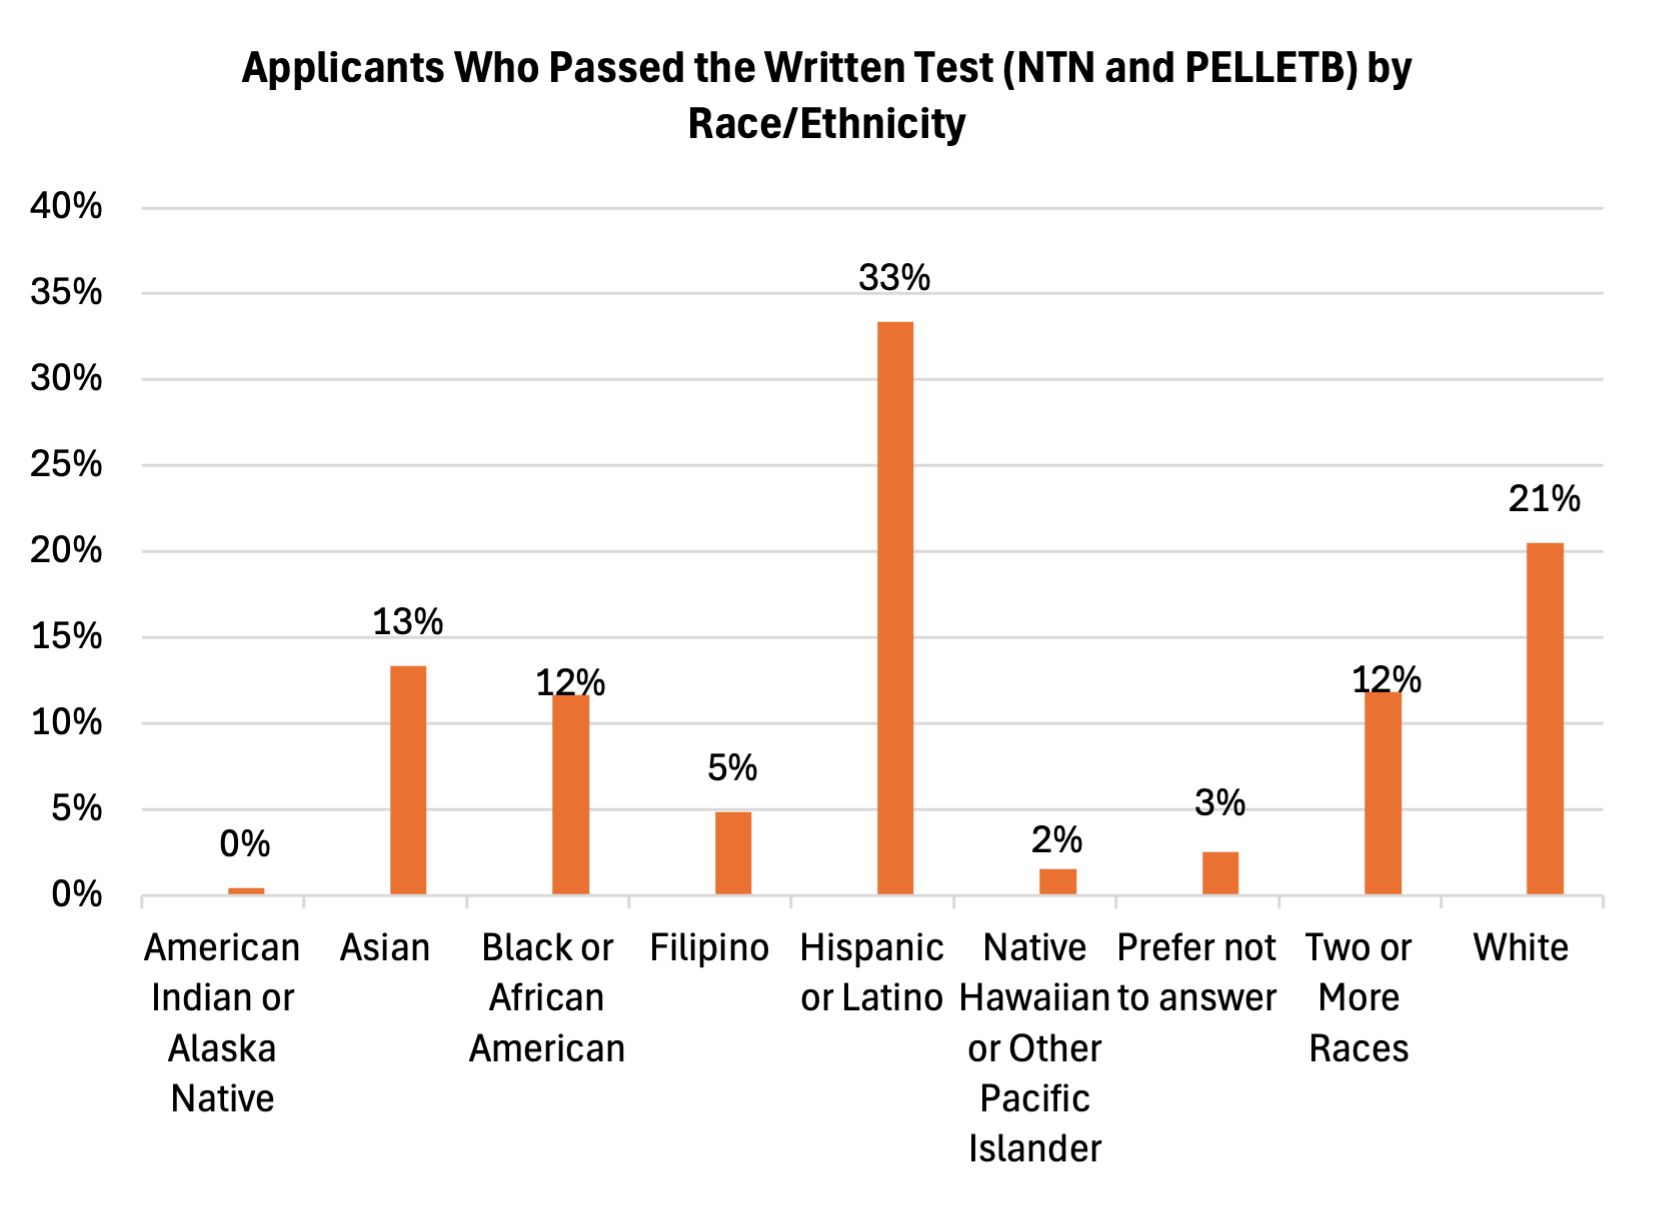
Applicants Who Passed the Written Test (NTN and PELLETB by Race/Ethnicity
| Race/Ethnicity | Percent |
|---|---|
| American Indian or Alaska Native | 0% |
| Asian | 13% |
| Black or African American | 12% |
| Filipino | 5% |
| Hispanic or Latino | 33% |
| Native Hawaiian or Other Pacific Islander | 2% |
| Prefer not to answer | 3% |
| Two or More Races | 12% |
| White | 21% |
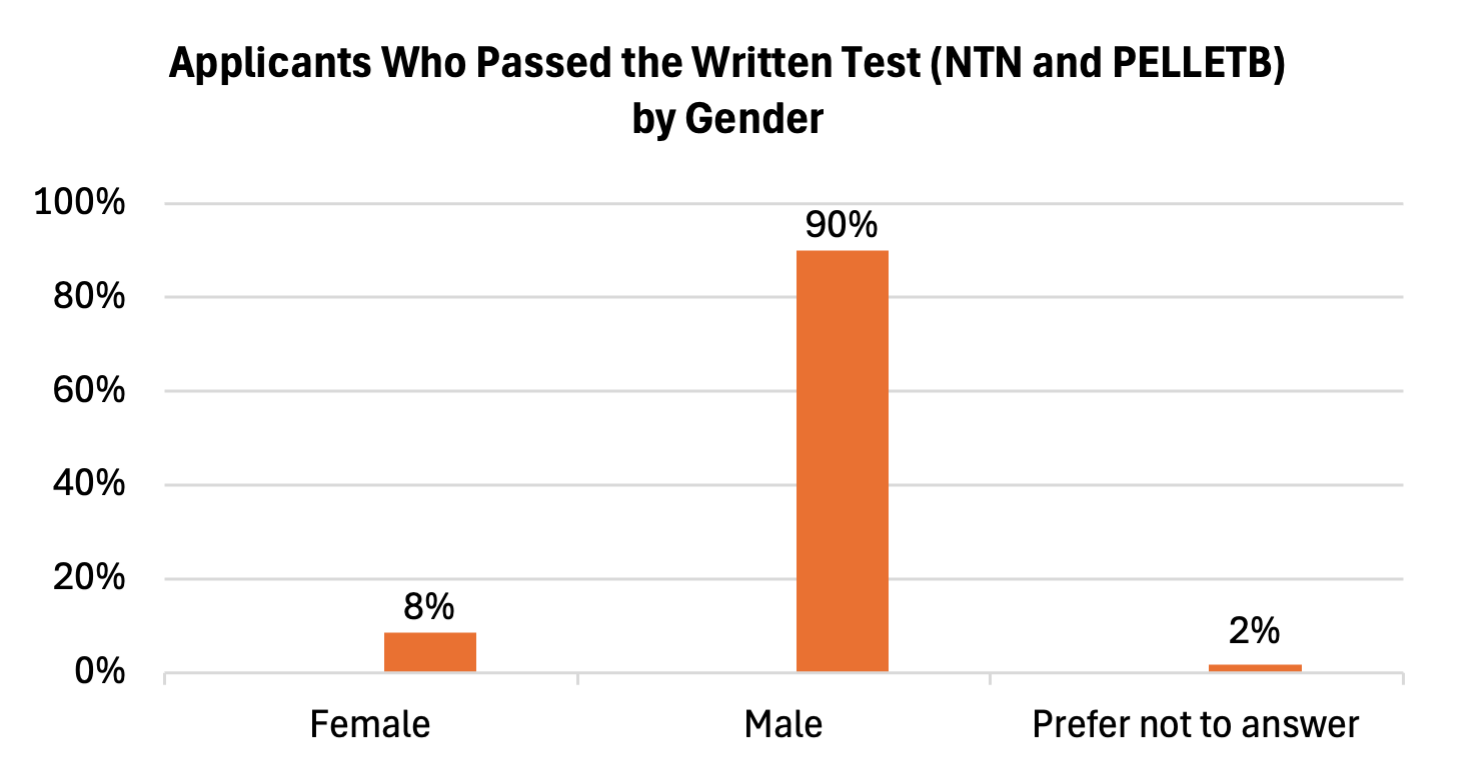
Applicants Who Passed the Written Test (NTN and PELLETB) by Gender
| Gender | Percent |
|---|---|
| Female | 8% |
| Male | 90% |
| Prefer not to answer | 2% |
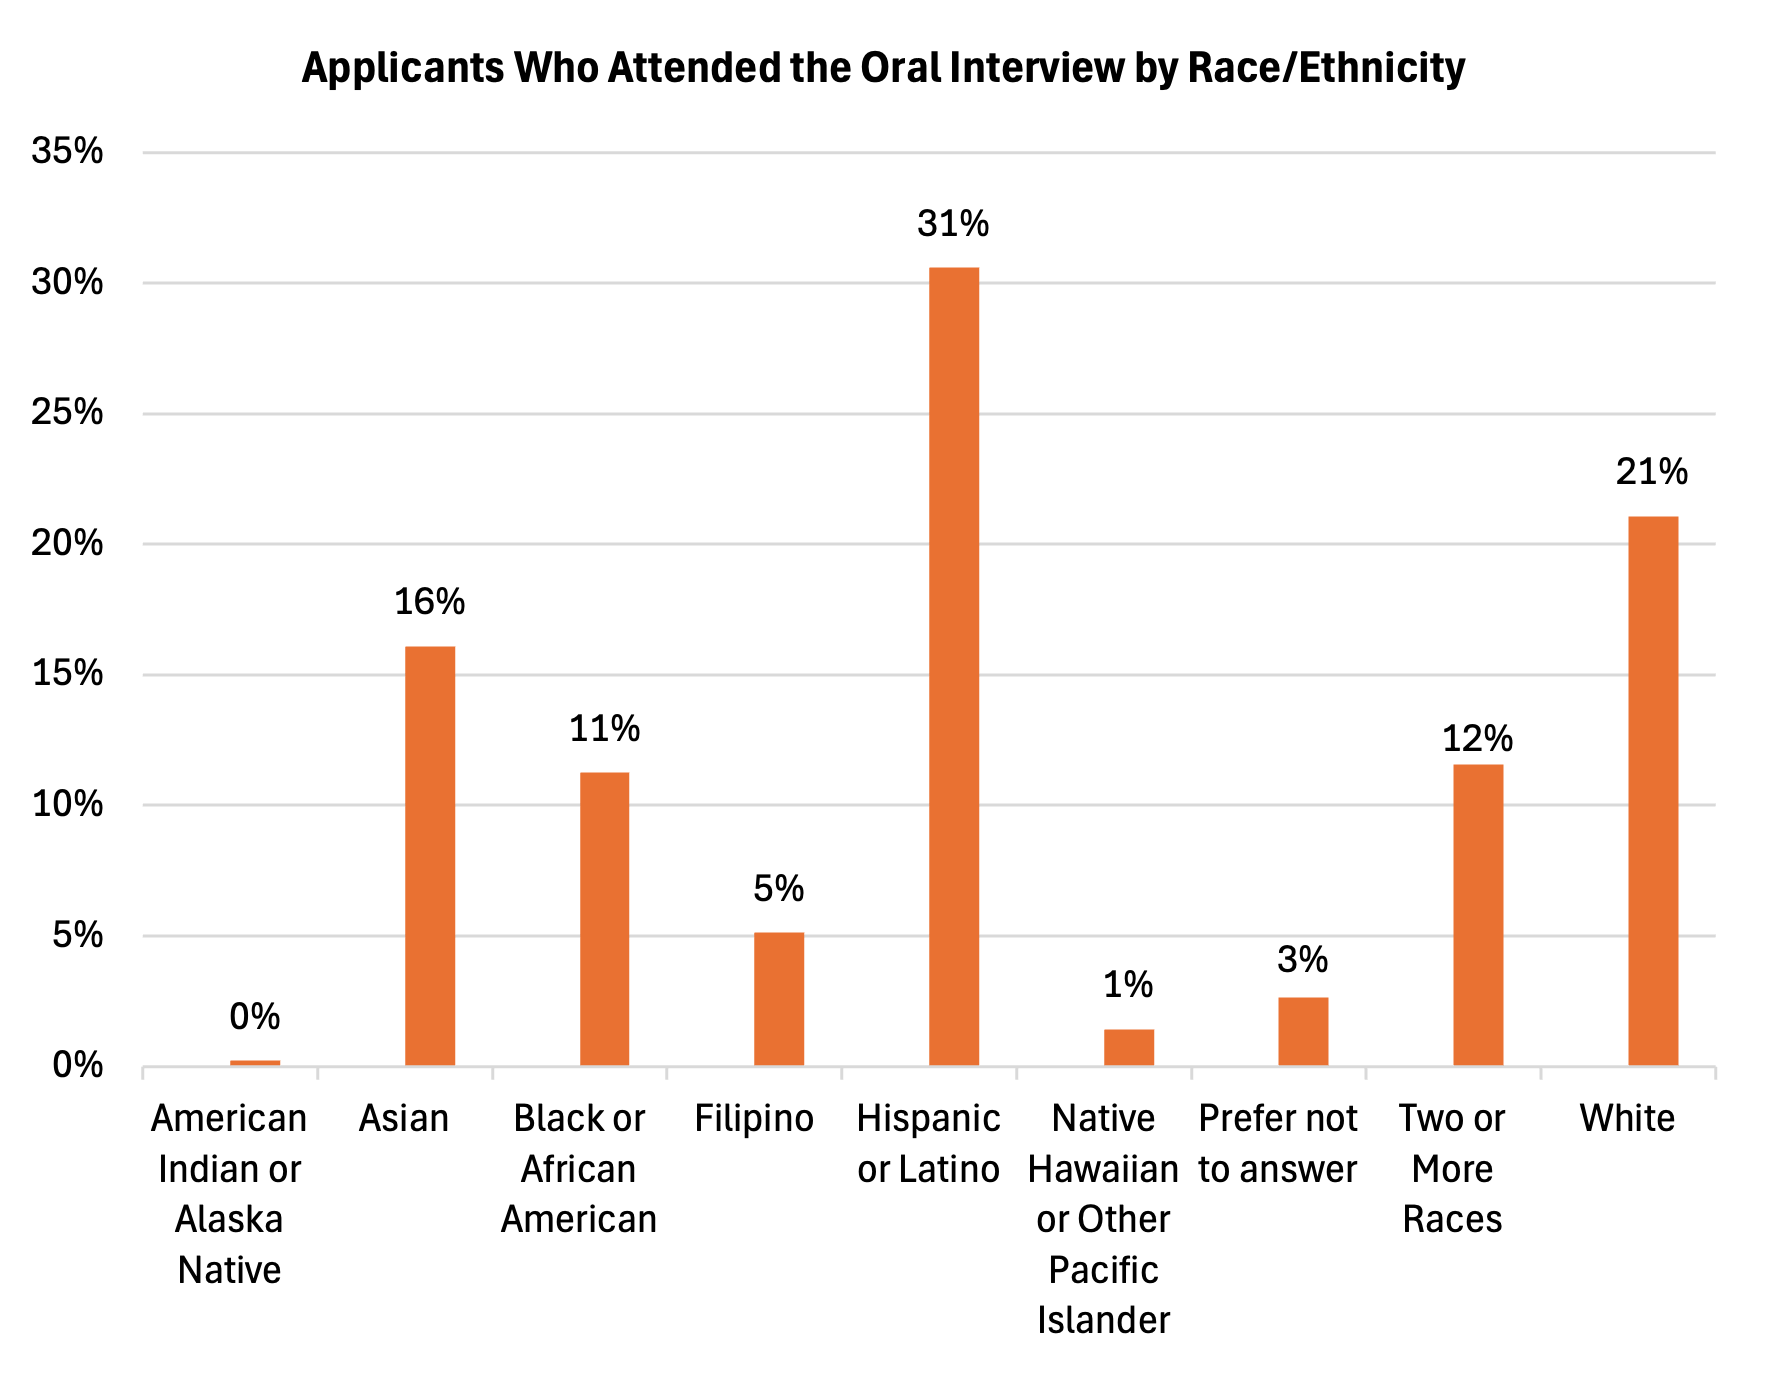
Applicants Who Attended the Oral Interview by Race/Ethnicity
| Race/Ethnicity | Percent |
|---|---|
| American Indian or Alaska Native | 0% |
| Asian | 16% |
| Black or African American | 11% |
| Filipino | 5% |
| Hispanic or Latino | 31% |
| Native Hawaiian or Other Pacific Islander | 1% |
| Prefer not to answer | 3% |
| Two or More Races | 12% |
| White | 21% |
Applicants Who Attended the Oral Interview by Gender
| Gender | Percent |
|---|---|
| Female | 8% |
| Male | 91% |
| Prefer not to answer | 1% |

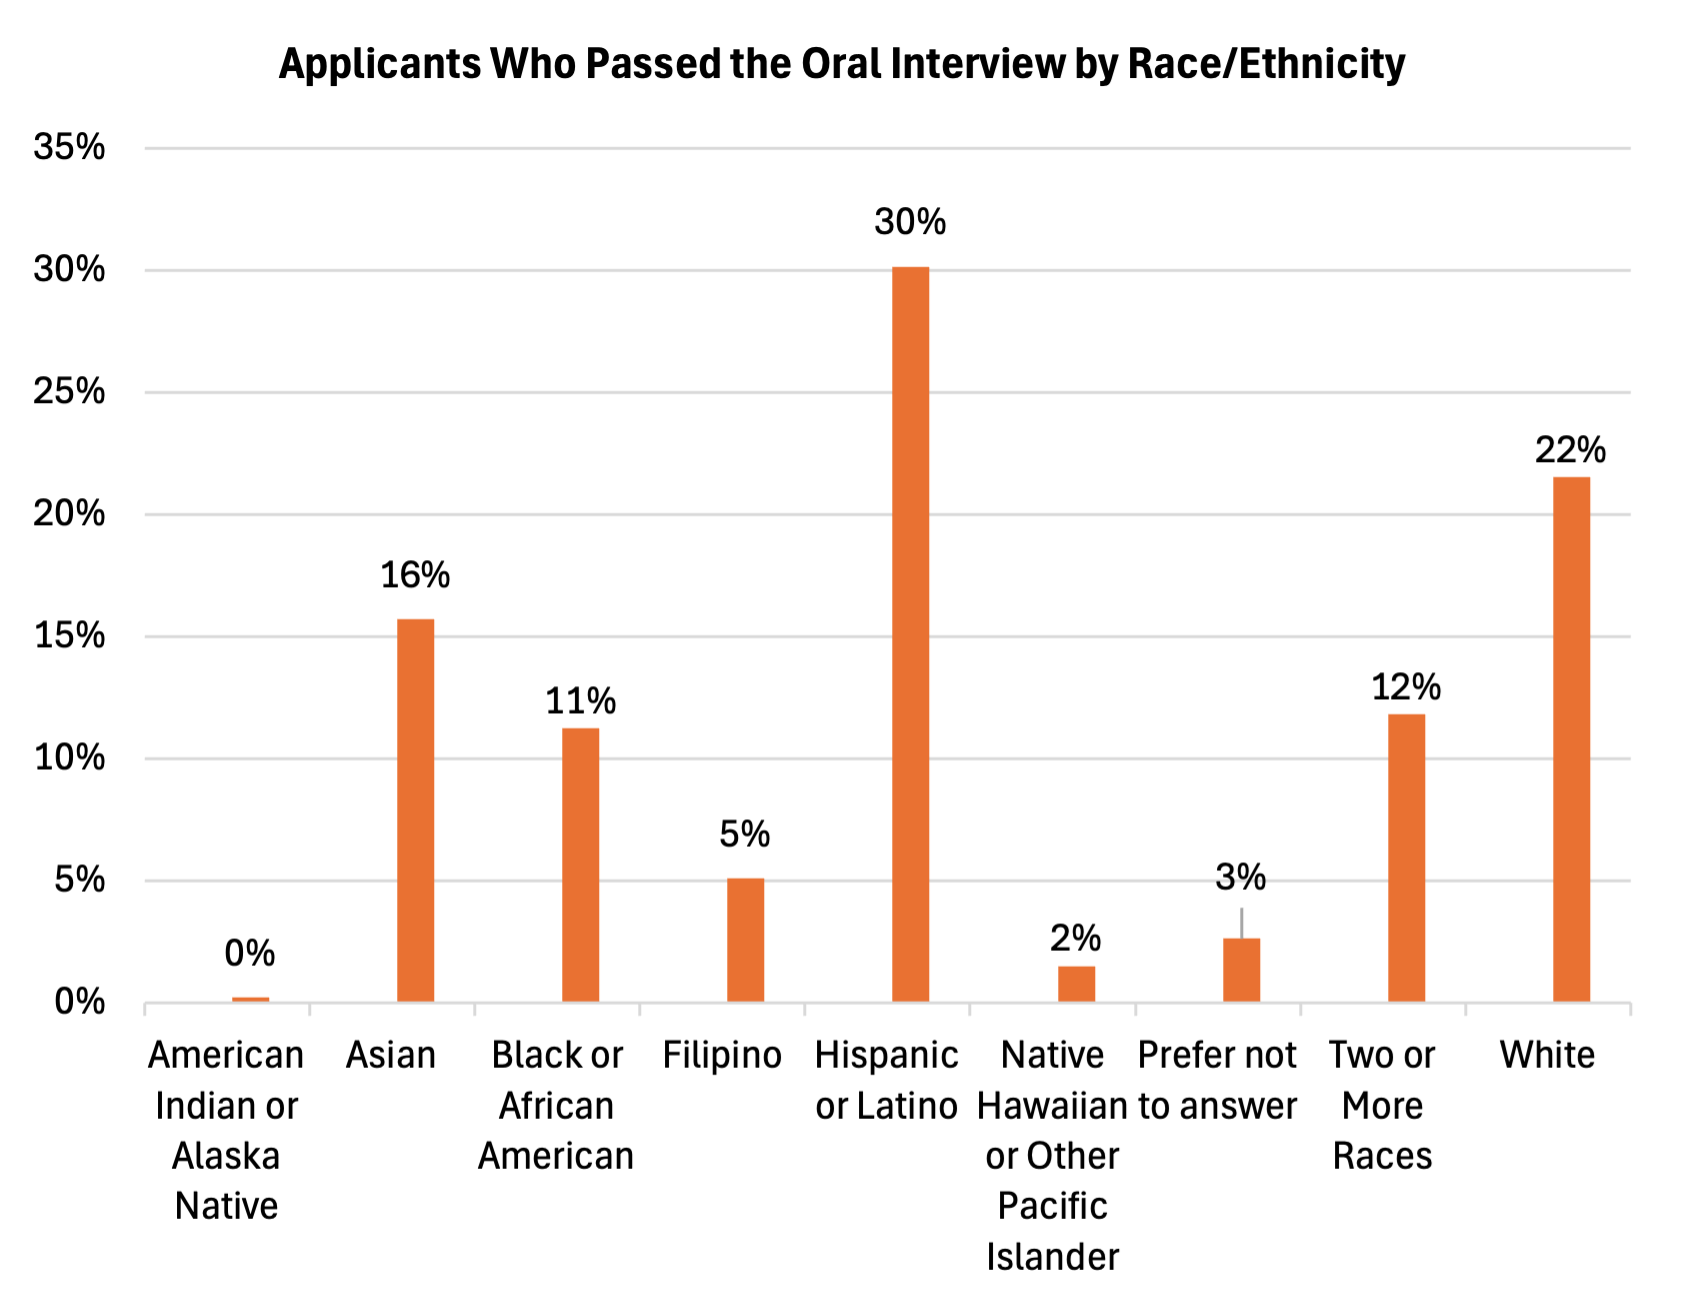
Applicants Who Passed the Oral Interview by Race/Ethnicity
| Race/Ethnicity | Percent |
|---|---|
| American Indian or Alaska Native | 0% |
| Asian | 16% |
| Black or African American | 11% |
| Filipino | 5% |
| Hispanic or Latino | 30% |
| Native Hawaiian or Other Pacific Islander | 2% |
| Prefer not to answer | 3% |
| Two or More Races | 12% |
| White | 22% |
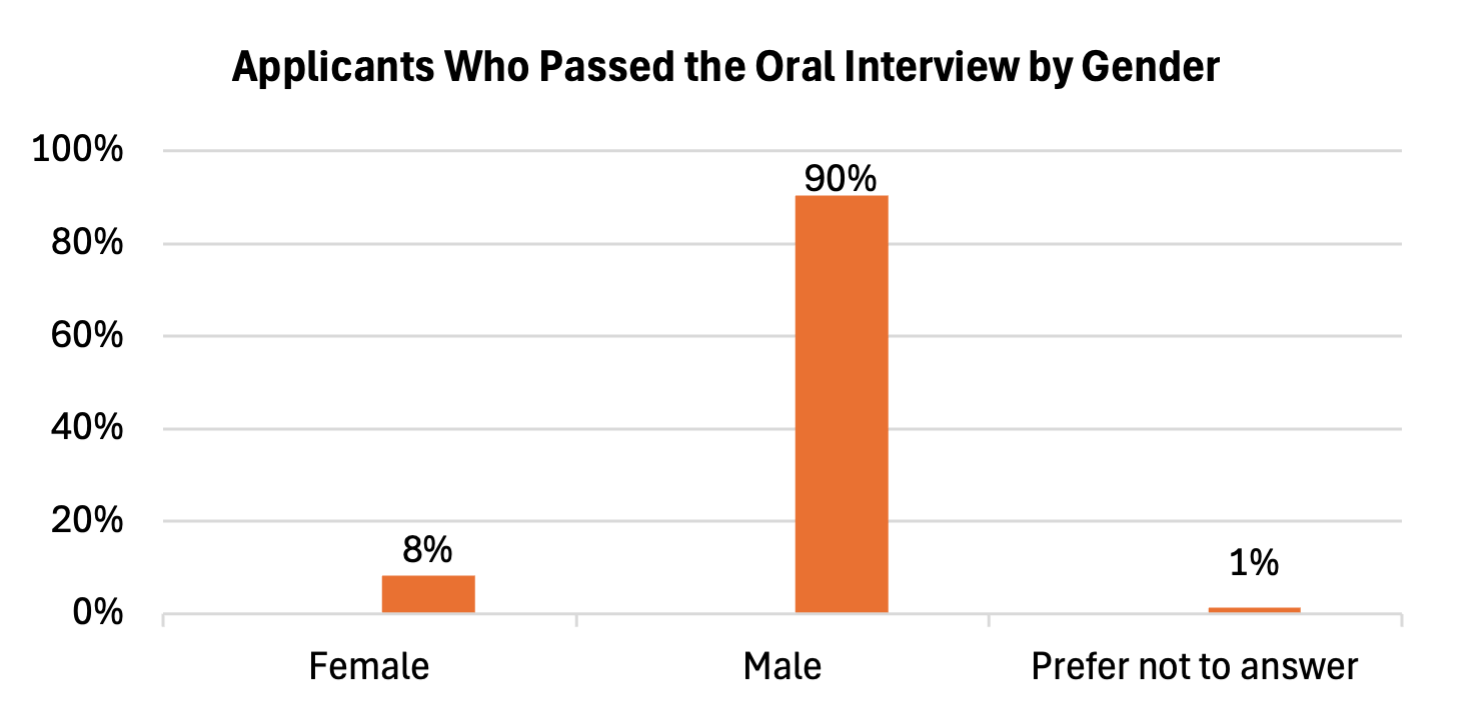
Applicants Who Passed the Oral Interview by Gender
| Gender | Percent |
|---|---|
| Female | 8% |
| Male | 90% |
| Prefer not to answer | 1% |
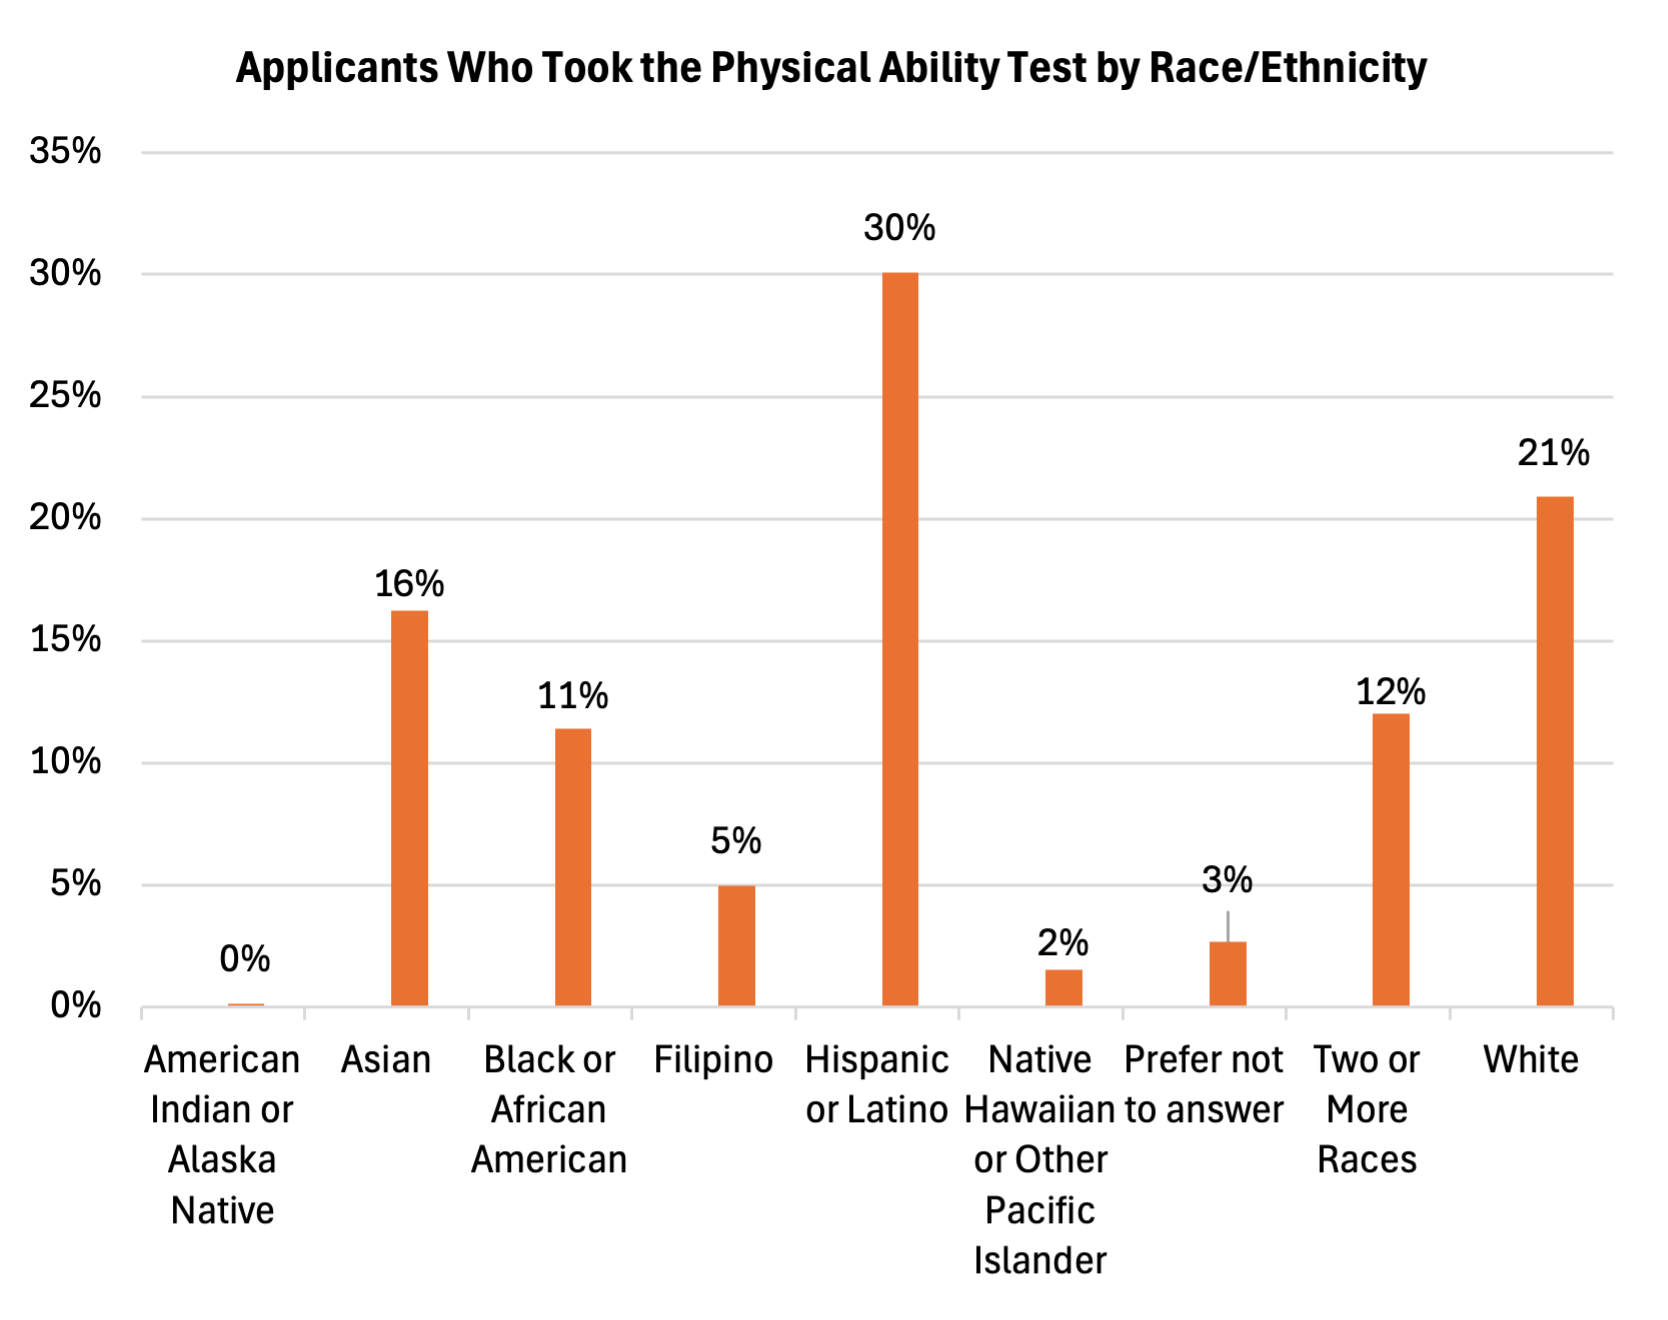
Applicants Who Took the Physical Ability Test by Race/Ethnicity
| Race/Ethnicity | Percent |
|---|---|
| American Indian or Alaska Native | 0% |
| Asian | 16% |
| Black or African American | 11% |
| Filipino | 5% |
| Hispanic or Latino | 30% |
| Native Hawaiian or Other Pacific Islander | 2% |
| Prefer not to answer | 3% |
| Two or More Races | 12% |
| White | 21% |
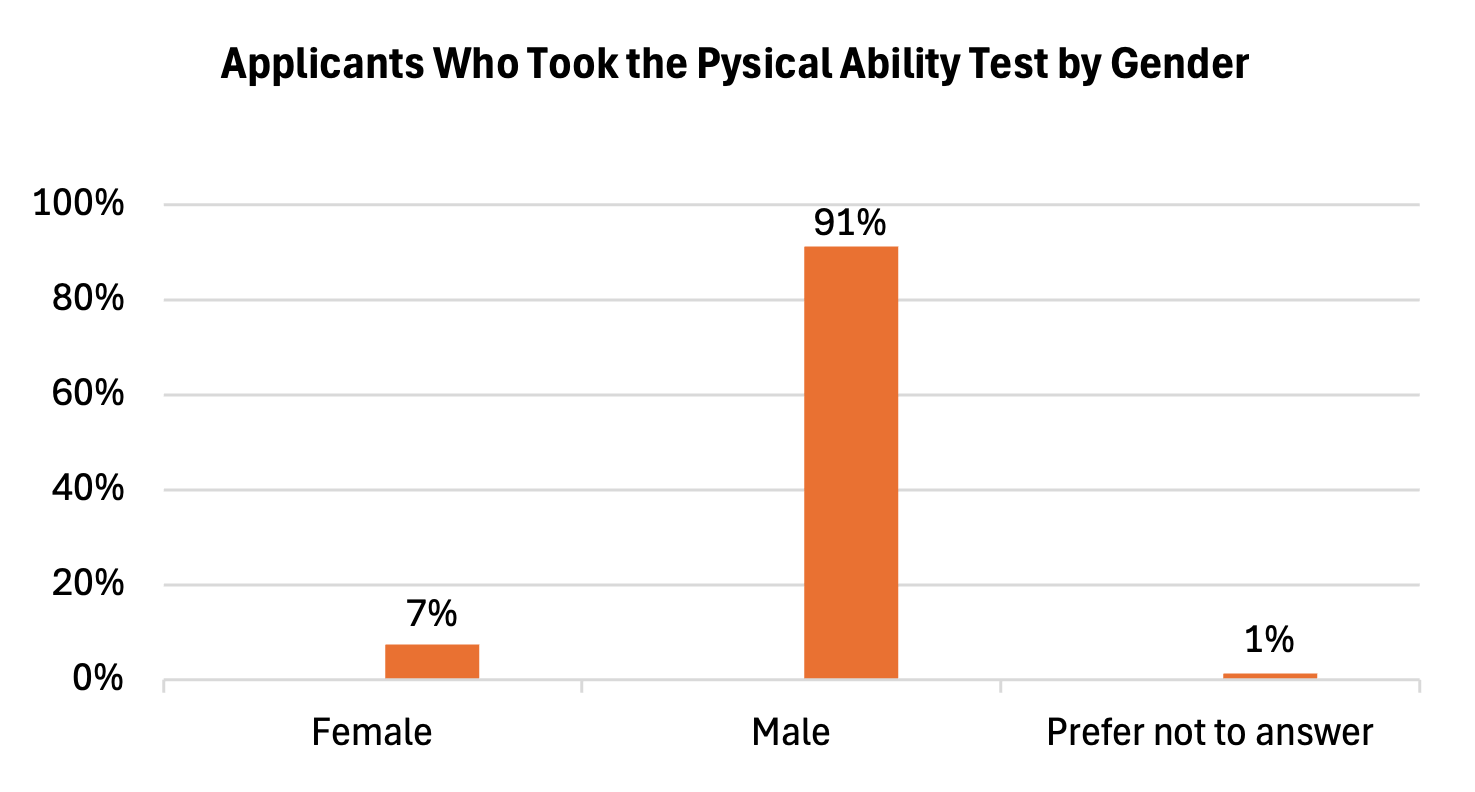
Applicants Who Took the Physical Ability Test by Gender
| Gender | Percent |
|---|---|
| Female | 7% |
| Male | 91% |
| Prefer not to answer | 1% |

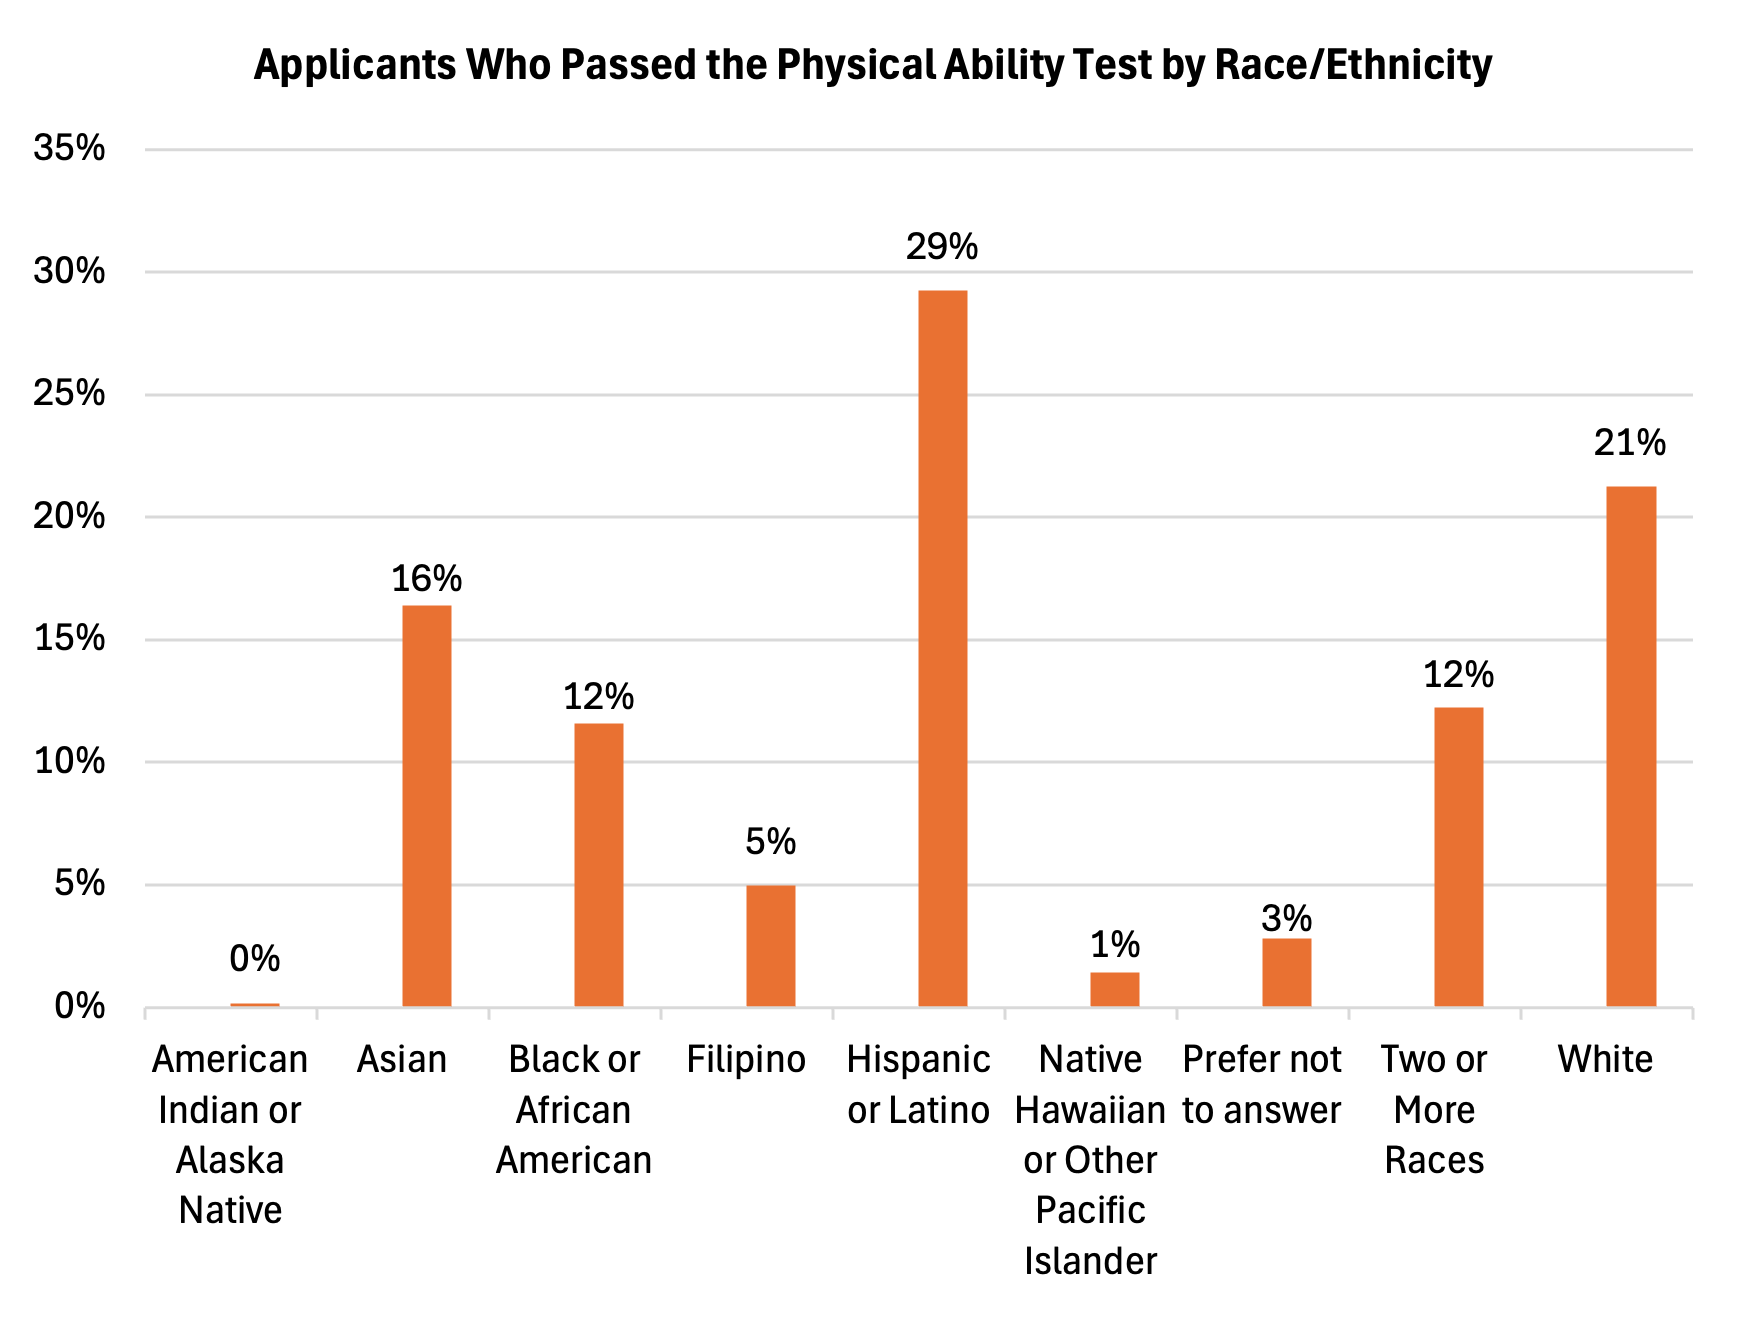
Applicants Who Passed the Physical Ability Test by Race/Ethnicity
| Race/Ethnicity | Percent |
|---|---|
| American Indian or Alaska Native | 0% |
| Asian | 16% |
| Black or African American | 12% |
| Filipino | 5% |
| Hispanic or Latino | 29% |
| Native Hawaiian or Other Pacific Islander | 1% |
| Prefer not to answer | 3% |
| Two or More Races | 12% |
| White | 21% |
Applicants Who Passed the Physical Ability Test by Gender
| Gender | Percent |
|---|---|
| Female | 6% |
| Male | 92% |
| Prefer not to answer | 1% |
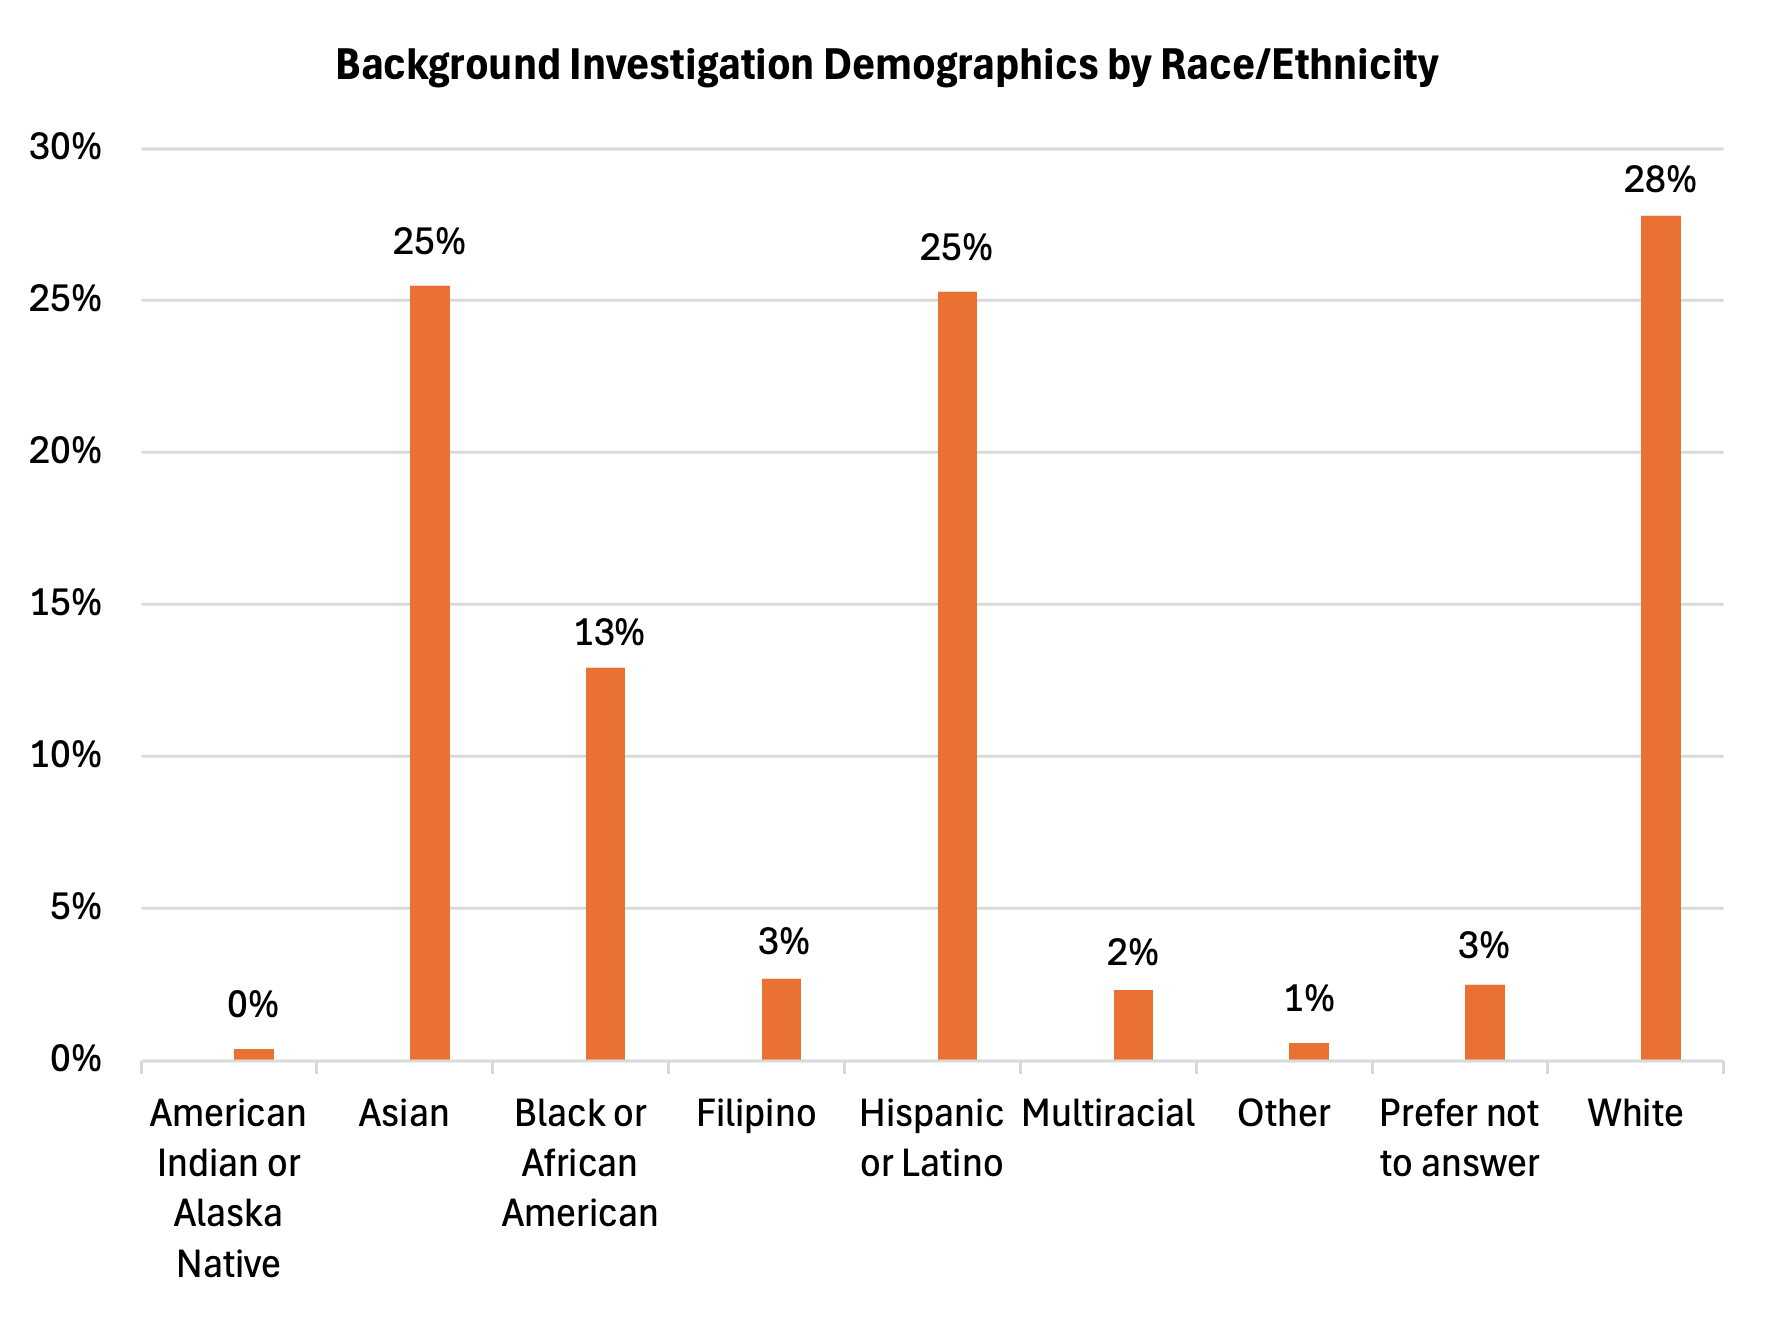
Background Investigation Demographics by Race/Ethnicity
| Race/Ethnicity | Percent |
|---|---|
| American Indian or Alaska Native | 0% |
| Asian | 25% |
| Black or African American | 13% |
| Filipino | 3% |
| Hispanic or Latino | 25% |
| Multiracial | 2% |
| Other | 1% |
| Prefer not to answer | 3% |
| White | 28% |
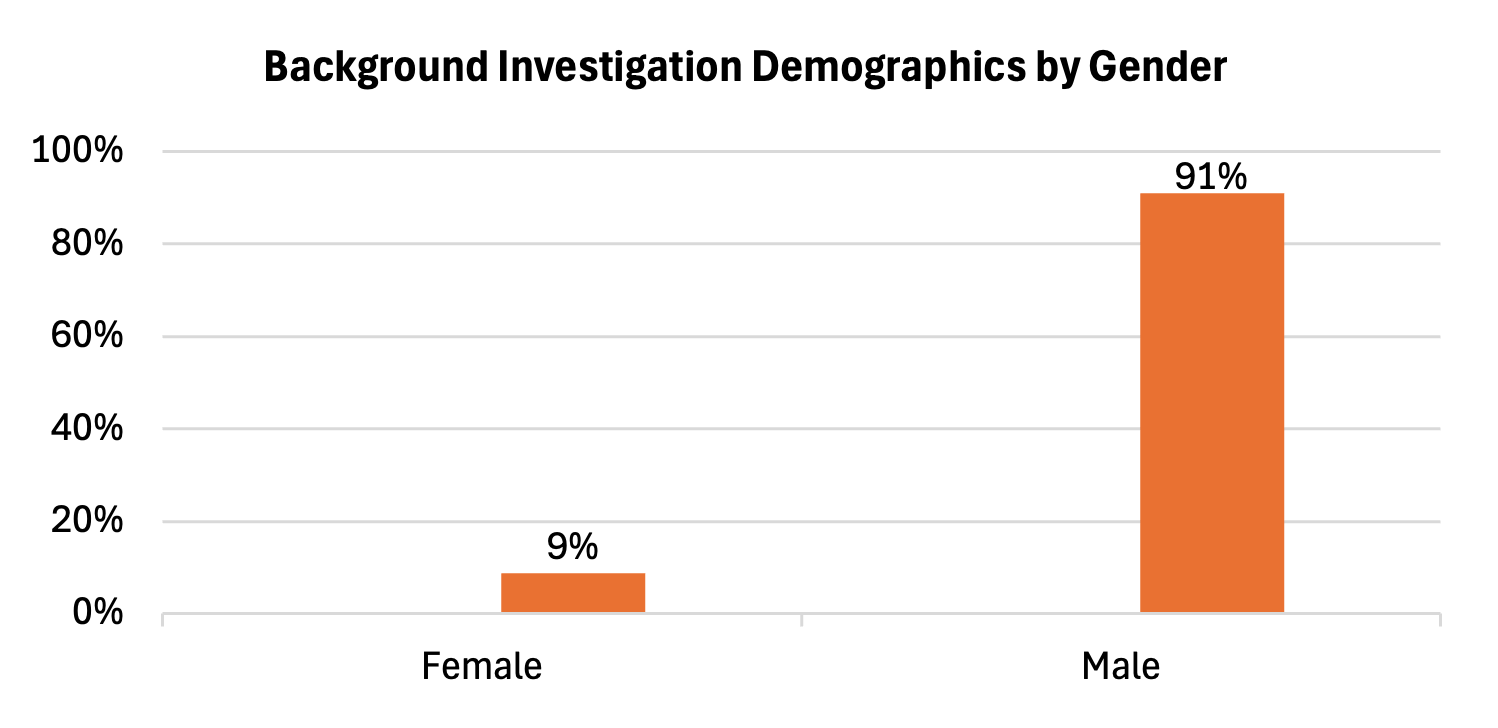
Background Investigation Demographics by Gender
| Gender | Percent |
|---|---|
| Female | 9% |
| Male | 91% |
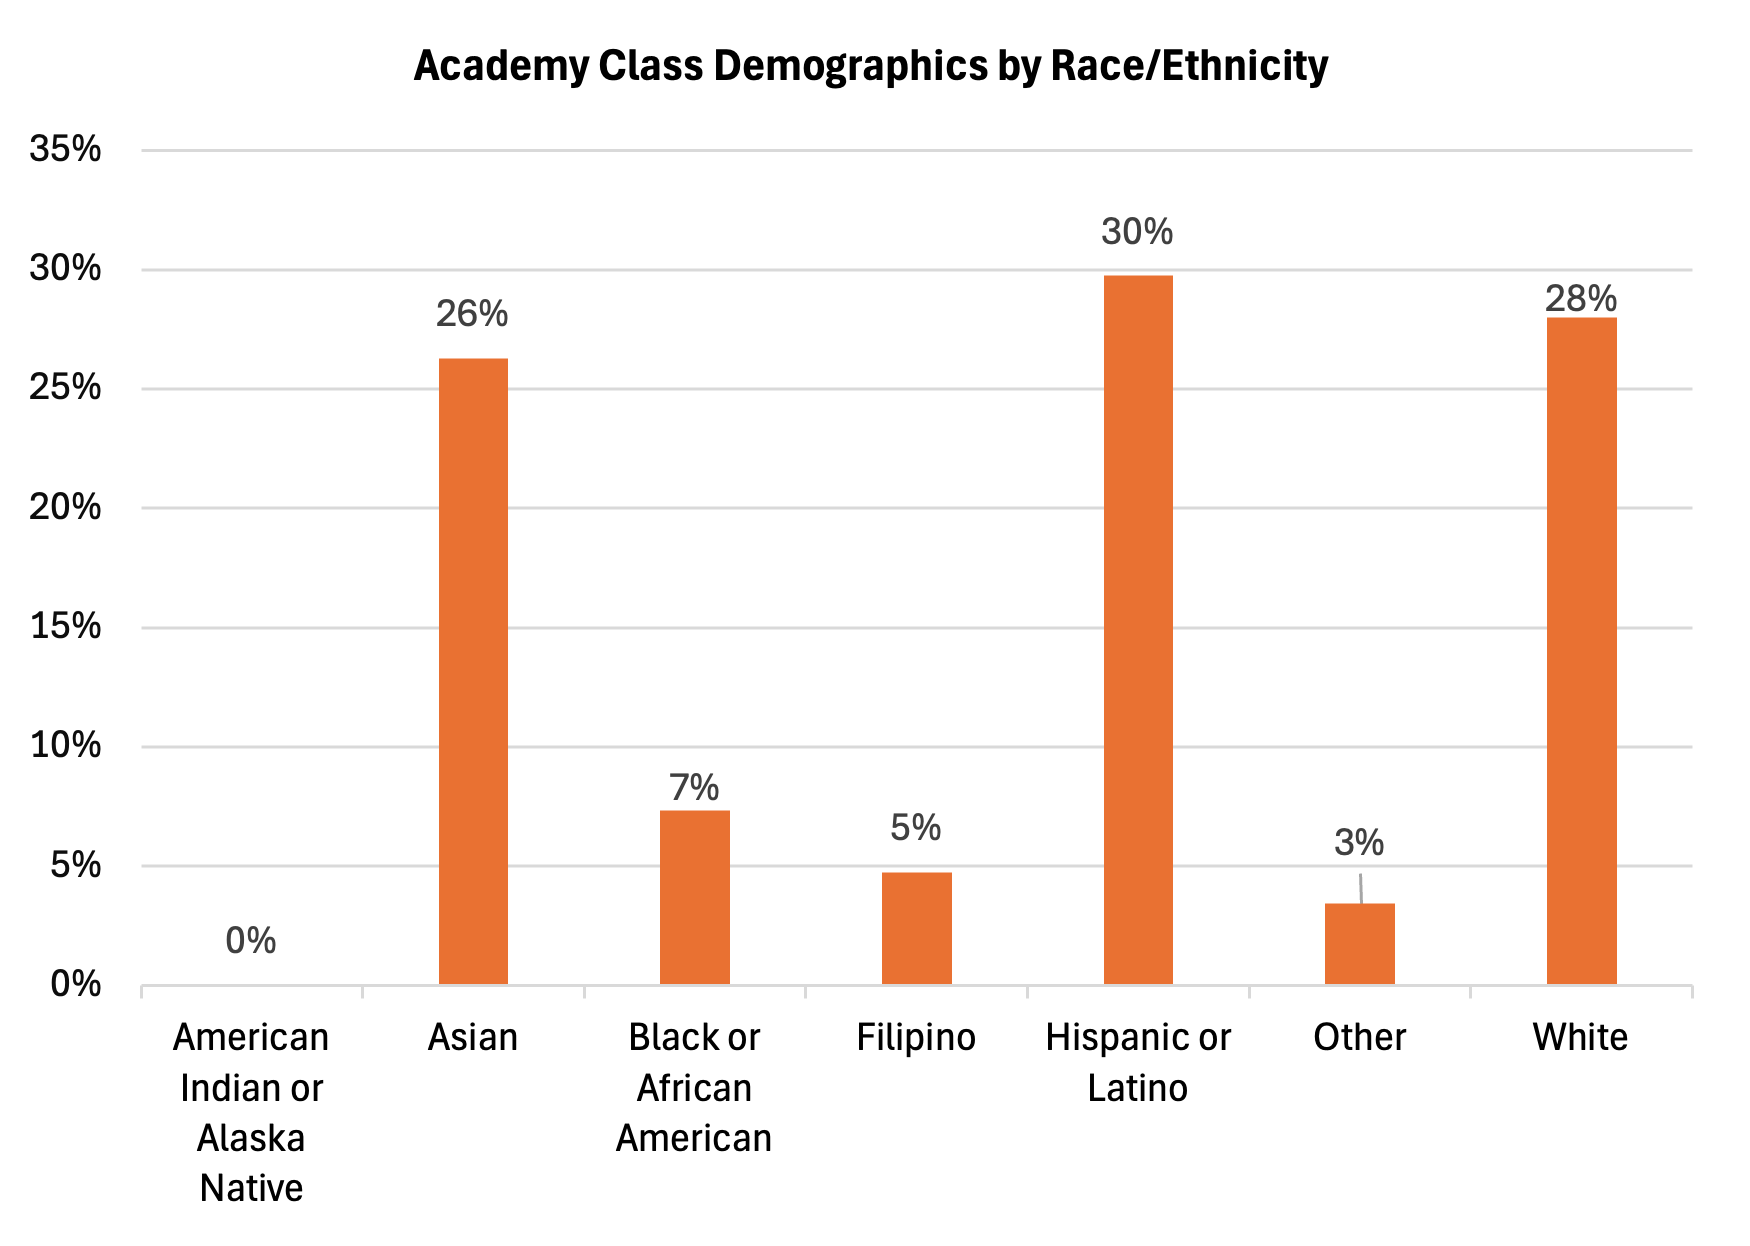
Academy Class Demographics by Race/Ethnicity
| Race/Ethnicity | Percent |
|---|---|
| American Indian or Alaska Native | 0% |
| Asian | 26% |
| Black or African American | 7% |
| Filipino | 5% |
| Hispanic or Latino | 30% |
| Other | 3% |
| White | 28% |
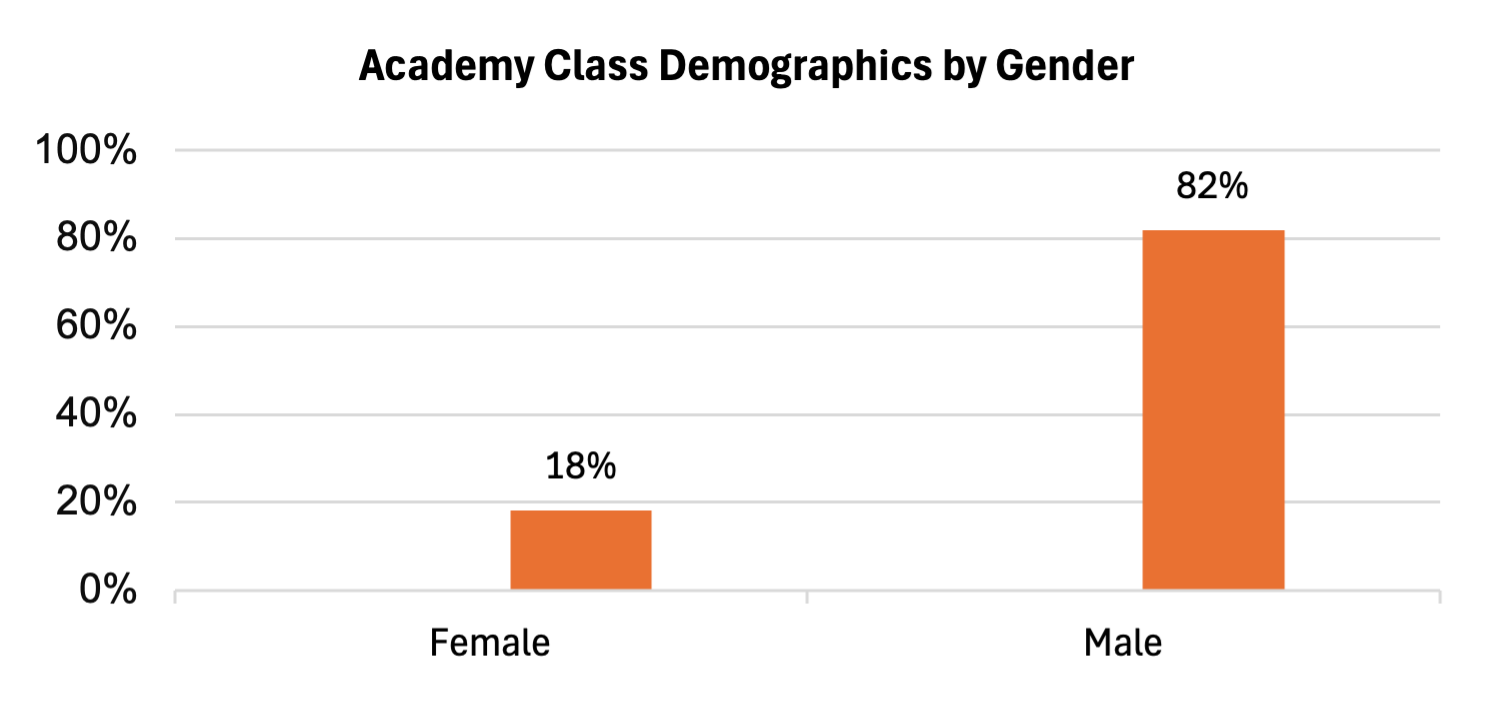
Academy Class Demographics by Gender
| Gender | Percent |
|---|---|
| Female | 18% |
| Male | 82% |