SFPD EIS: Historical EIS Review and Data Driven EIS Approach
Center for Data Science and Public Policy, The University of Chicago
June 10, 2018

- 1 Executive Summary
1.1 Background
The Center for Data Science and Public Policy (DSaPP) at The University of Chicago has partnered with the San Francisco Police Department (SFPD) and DataSF as part of the Civic Analytics Network (CAN) funded by the Laura and John Arnold Foundation to explore the replication of the DSaPP Data-Driven Early Intervention System (EIS). This EIS has already been implemented at the Charlotte-Mecklenburg Police Department (CMPD) and the Metro-Nashville Police Department (MNPD). This document reviews our assessment of SFPD’s current EIS and processes, its performance, how it compares with the DSAPP EIS, and our recommended next steps to increase the effectiveness of the EIS Program at SFPD.1.2 Goals
The goal of an EIS is to proactively identify officers who display patterns of problematic performance or who show signs of job and personal stress in order to intervene and support those officers with training, counseling, or other preventative interventions. When an EIS alert is raised, that alert should indicate that the officer is at high risk of having an adverse incident in the near future. Based on our prior work and discussions with SFPD, we define an adverse incident as one where an Internal Affairs Department (IAD) investigation leads to a sustained, unjustified, or preventable finding. An EIS can make two types of mistakes:- False Positives: Flagging officers incorrectly (raising an alert when they are not at risk)
- False Negatives: Missing At-Risk Officers (Not flagging someone when they are at risk).
The goal of an EIS is to minimize both of these types of errors. The work described in this report 1) evaluates the historical performance of SFPD’s Existing EIS and program based on both of these metrics and 2) evaluates performance improvements SFPD could expect if they were to implement DSaPP’s data-driven EIS.
1.3 Historical Evaluation for the Existing EIS program
Based on the data we received, we identified two distinct phases the SFPD EIS program has gone through: one that ended in 2015, and the current one that has been running since 2016. During both of these phases, SFPD’s current EIS has been threshold-based: It issues an alert for any officer who reaches a predefined number of trigger events in a given time window, such as three (threshold) complaints (trigger event) in a six-month period (time window). SFPD’s current EIS program uses a two-stage process: the automated threshold-based system (AIM) generates alerts, then the EIS Sergeant reviews and filters those to create final alerts. We conducted historical analysis for both phases, using data until December 2017, and find that the existing EIS program (the system and the manual reviewing combined) was correct on 61 out of 941 alerts (6.5% alert-level accuracy) and 32 out of 385 officers identified (8.3% officer-level accuracy).1.4 DSaPP’s Data Driven Early Intervention System
In contrast to the threshold-based EIS, DSaPP’s data-driven EIS takes all available data and uses machine learning methods to detect patterns that precede adverse incidents, making the EIS predictive and enabling prioritized and preventative interventions. Our prototype analyzed thousands of variable combinations (e.g. traffic stops, arrests, use of force, compliments, dispatches, IAD interventions, training) over time to determine which of them best identify officers at risk in the near future and generated a risk score for every officer for a given day. This risk score can then be used to prioritize officers for interventions. Of the 266 officers our system identified as highest risk between January 2015 through January 2017, over 55 went on to have a sustained, unjustified, or preventable Internal Affairs incident during the next 12 months, giving us 21% officer-level accuracy (compared to 8% for the existing SFPD EIS).1.5 Comparing the two systems:
We further compare the two systems on data from 2016-2017. As we can see from the Figure below, the DSaPP EIS (orange bars) has a higher percentage (more than 2x) of correct flags than the existing SFPD EIS (blue bars). It’s important to note that the existing SFPD system consists of a trigger system augmented by the Sergeant review that further filters the flags, whereas the DSaPP EIS efficiency is just that of the automated system. We would expect the performance to improve once the Sergeant review step gets added to it.Image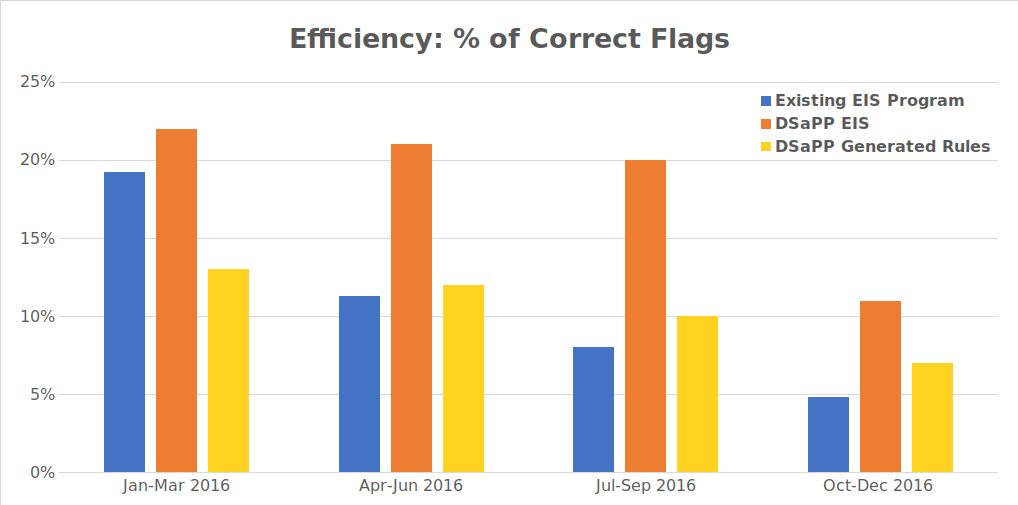
Figure 1. Efficiency (# of correct flagged officers / Total # of triggered flags) of the three systems In addition to measuring efficiency across the two systems, we also found that:
- If the DSaPP EIS flags the same number of people as the SFPD EIS, the DSapp EIS finds 2-3 times as many officers who go on to have adverse incidents in the next year.
- To find the same number of correctly identified officers as the SFPD EIS, the DSaPP EIS can be more efficient and only flag 2x-3x fewer officers.
Based on SFPD’s request, we built an additional EIS system. This system takes the threshold type triggers that the existing SFPD system uses but determines the trigger events and thresholds using the data we have access to. SFPD requested this to understand the best possible performance any threshold based system can achieve, even if it’s data-driven. The yellow bar in the figure above shows the evaluation of that system, and as we can observe, the performance is comparable to the existing EIS and significantly worse than the DSaPP data-driven EIS.
This analysis leads us to conclude that the reasons for the inaccuracies of the existing SFPD EIS are two-fold:
a. Lack of the system being data-driven
b. The inherent limitations of a system being based on simple triggers and thresholds. Even adding data analysis capabilities to a threshold-based system doesn’t result in a significant improvement, leading us to conclude that threshold-based EISs are ineffective at identifying at-risk officers.
1.6 What types of officers do these systems flag?
In addition to the evaluation shown above, we also compared the two systems on what types of officers they each flag and prioritize. The table below shows the comparison:Table 1: Compared the two systems on what types of officers they each flag and prioritize DSaPP Data-Driven System Existing SFPD EIS Flagged Officers are likely to have:
7x more closed IAD cases
5x more IAD Incidents
2.7x more EIS Alerts
2x more Arrests
2x more Recent Activity3x fewer Compliments
3x less Overtime worked
2.5x less Secondary Employment
2.5x less Sick Leave
1.5x fewer Vehicle PursuitsFlagged Officers are likely to have:
10x more EIS Alerts
7x more UOF Incidents
5x more Vehicle Pursuits
2.8x Arrests
2.4x more Recent Activity
1.3x Overtime worked3x less Secondary Employment
1.3x less Sick LeaveOur findings based on the differences shown above are that:
- SFPD EIS primarily flags officers based on historical EIS Alerts and Use of Force incidents compared to the DSaPP system that flags officers with more IAD incidents and closed cases.
- SFPD’s existing system is more activity-based than DSaPP’s system: it tends to flag officers with more vehicle pursuits, arrests, recent activity, and overtime worked, compared to the more nuanced DSaPP system (note the officers flagged with fewer vehicle pursuits and overtime worked).
1.7 Conclusions
- The existing SFPD EIS (combined decisions based on the threshold-based triggers and the Sergeant review) is highly inaccurate, with ~8% of flagged officers actually going on to have adverse incidents in the next year.
- This performance can be improved by using DSaPP’s data-driven EIS, as the evaluation shows 21% correct flags for the same time period as in #1. There is potential for even more improvement if the officer predictions from the system are then run through the same Sergeant review process as the existing EIS.
- The DSaPP EIS is flexible - it can flag the same number of officers as the current EIS and find more at-risk officers, or it can be used in a more focused manner to reduce the number of flags and find the same number of at-risk officers.
- The existing SFPD EIS and the DSaPP are not not only different in the percentage of correct flags but they also flag different types of officers. The existing EIS flags officers with high number of historical EIS Alerts and UOF incidents, and officers with more activity in general. The DSaPP EIS uses all the historical data to generate flags more accurately in a more nuanced manner, without relying purely on activity or historical EIS alerts.
- We find that the reasons for the inaccuracy of the existing SFPD EIS are two-fold: a. Lack of the system being data-driven b. The inherent limitations of a system based on simple trigger and thresholds.
- The review process, currently being performed by the EIS Sergeant, reduces the number of flags generated by the EIS program, but does not result in more efficiency. The same percentage of flags are correct, before and after the review process, leading us to believe that there is potential in improving this Sergeant review process.
1.8 Recommendations and Next Steps
- SFPD should explore the development and implementation of a data-driven EIS, similar to that of the DSaPP EIS to improve the effectiveness of the EIS program. We recommend taking the following steps to move forward:
- Work with DSaPP to generate a list of currently at-risk officers.
- Design and conduct a pilot to validate the findings of the DSaPP prototype going forward.
- Improve the data collection systems currently being used at SFPD in order to improve the EIS program, collecting more fine-grained data, capturing the entire EIS process as well as interventions instead of just the outcomes, and better data integration across different data systems in SFPD.
- Review the existing EIS Sergeant filtering and review process being used in the EIS program
- Explore methodologies to evaluate the effectiveness of existing interventions in order to determine appropriate interventions for individual officers, and improve the effectiveness of the EIS program.
The detailed report goes into the details of our work and findings, as well as more detailed recommendations based on on this work.
1.9 Limitations and Caveats:
Our analysis has a few limitations and caveats that we lists here, primarily based on the data we received:- The data has limited temporal and geographical granularity. For example, many of the events are aggregated at the month level, making it impossible to order events over time (within a month) and detect predictors of future adverse incidents. Similarly, events not having a location tied to them hinders our ability to understand the context of an event and use it effectively.
- Limited ability to link events to officers. For example, dispatches not being linked to officers stops us from correlating officers being dispatched to certain types of calls to their future risk of adverse incidents (which has been shown to be predictive in other departments we have worked with).
- Lack of closed IAD/OIS investigations for the last year of the data. Since IAD cases typically take around 12 months to finish, the latest reliable (closed) IAD (cases) data we have is from January 2017, making that the last time we can generate or evaluate our predictions.
1.10 Acknowledgements
This work was funded by the Laura and John Arnold Foundation through the Civic Analytics Network (a grant to replicate projects and use cases among cities), and enabled with the participation of Joy Bonaguru and Data SF. We thank SFPD for their partnership and for providing access to expertise and data for this project. - 2 Background
2.1 Purpose of this document
The Center for Data Science and Public Policy (DSaPP) at The University of Chicago has partnered with the San Francisco Police Department (SFPD) and DataSF as part of the Civic Analytics Network (CAN) funded by the Laura and John Arnold Foundation to explore the replication of the DSaPP Data-Driven Early Intervention System (EIS). This EIS has already been implemented at the Charlotte-Mecklenburg Police Department (CMPD) and the Metro-Nashville Police Department (MNPD). This document reviews our assessment of SFPD’s current EIS and processes, its performance, how it compares with the DSAPP EIS, and our recommended next steps to increase the effectiveness of the EIS Program at SFPD.2.2 What does an EIS do and how to measure its performance?
The goal of an EIS is to proactively identify officers who display patterns of problematic performance or who show signs of job and personal stress in order to intervene and support those officers with training, counseling, or other preventative interventions. When an EIS alert is raised, that alert should indicate that the officer is at high risk of having an adverse incident in the near future. Based on our work with several departments, we have defined that “near future” to be 12 months but our EIS is flexible enough to modify that to a shorter or longer time period.An EIS can make two types of mistakes:
- False Positives: Flagging officers incorrectly (raising an alert when they are not at risk)
- False Negatives: Missing At-Risk Officers (Not flagging someone when they are at risk).
The goal of an EIS is to minimize both of these types of errors. We use two metrics to capture those two types of errors1, and both can be calculated at the alert level over a period of time (where each alert, even if it is for the same officer multiple times, counts equally) or at the officer level (where multiple alerts about an officer count as one alert):
- Efficiency2 is the proportion of correct alerts out of all alerts. At the officer level, It is the 2 percentage of officers flagged by an EIS that go on to have an adverse incident in the next 12 months. For SFPD, this calculation is done per month and is given by:
Efficiency = Officers in the list who will have an adverse incident in the next 12 months / Number of officers on the list - Coverage3 is used to evaluate what percentage of officers who go on to have adverse 3 incidents are flagged by the EIS. It is the proportion of correctly identified flags out of all officers who have an adverse incident. More specifically, of all the officers who have adverse incidents in the next 12 months, coverage is the percentage that are in the list generated by the model.
The coverage is calculated using:
Coverage = Number of Officers Correctly Identified by the System for a given time period / Number of Officers with Adverse Incidents in that time period
As an example, consider the situation where 100 alerts are generated by an EIS. If 10 of those officers have an adverse incident in the next year, the efficiency of the system is 10%. If 40 additional officers who were not included in the 100 officers with alerts also have an adverse incident in the next year, the coverage is 10/(10+40) = 20%. An ideal EIS has high efficiency (only generates alerts for officers who go on to have adverse incidents in the future) and high coverage (does not miss officers who go on to have adverse incidents in the future). In practice, there is often a tradeoff between coverage and efficiency and an effective EIS system should be tunable to allow Police Departments to choose a tradeoff based on the number of alerts total that they can address.
The work described in this report 1) evaluates the historical performance of SFPD’s Existing EIS and program based on both of these metrics and 2) evaluates performance improvements SFPD could expect if they were to implement DSaPP’s data-driven EIS.
1 We would add additional metrics if the data-driven EIS were put into production, such as EIS program effectiveness (which would estimate how many adverse incidents the EIS program prevents).
2 In academic literature, this is known as precision o r positive predictive value, which is defined as True Positives/(True Positives + False Positives)
3 In academic literature, this is known as recall or sensitivity, which is defined as True Positives/(True Positives + False Negatives)
2.3 Existing Threshold-Based Early Intervention Systems
Police departments around the country, including SFPD, have been using threshold-based EISs to identify officers at high risk of having adverse incidents. In a threshold-based EIS, an officer who reaches a predefined number of incidents in a given timeframe—such as 3 complaints in 180 days—is flagged. The officer’s supervisor then determines whether the officer should receive an intervention, which is often counseling or retraining.Threshold-based Early Intervention Systems tend to have several problems:
- They are inaccurate, both flagging officers that do not go on to have an adverse incident and missing officers who do, resulting in low efficiency and low coverage
- They do not take into account the context of the officer’s activity, such as beat or special assignment.
- They either flag or not flag an officer, but cannot prioritize at-risk officers by level of risk, making it difficult for departments to decide which officers to prioritize for support and interventions.
- They are potentially gameable — multiple departments have expressed concern that officers modify their behavior slightly to avoid hitting thresholds.
- They are difficult and expensive to adapt and improve, sometimes even requiring external contractors to review and modify the system.
- They don’t provide department leaders information about how supervisors review cases and decide on interventions.
As a result, threshold-based early interventions systems fail to achieve full impact and may even lack credibility.
2.4 Our Prior work with Police EIS
Over the past three years, DSaPP has partnered with, and done extensive work with the Charlotte-Mecklenburg and Metropolitan Nashville Police Departments to build the first data-driven EIS for police officers. This work was initiated by the Police Data Initiative launched by the Obama White House based on the report by the President’s Task Force on 21st Century Policing. The DSaPP EIS has proven more accurate, adaptable, and insightful than threshold systems. SFPD read about our work with CMPD in Police Chief Magazine and contacted us about developing an EIS. The Civic Analytics Network provided funding to DSaPP in order to partner with SFPD to analyze the existing SFPD EIS and explore the development a data-driven EIS beginning in June 2017.2.5 What do we need to build a data-driven EIS?
- Definition of an adverse incident: Based on our previous work with police departments and discussion with SFPD, we defined an adverse incident as an internal affairs department (IAD) investigation or if there is an investigation because the officer was involved on a shooting (OIS) that is sustained, unjustified, or preventable. We also include every officer-involved shooting or discharge ruled not in policy. The SFPD team mapped the department’s ruling codes to these reduced categories - e.g.: “sustained”, “preventable” or “unjustified”.
It is important to note that the model is not making a decision whether an event was adverse. It simply learns patterns associated with the department’s past rulings. If a department never finds incidents to be adverse, the system cannot identify high-risk officers. - Historical data on police officers with and without adverse incidents spanning 3+ years: The data-driven EIS takes as input, historical data on incidents such as use of force, pointing of firearms, complaints as well as the outcomes of IA investigations, adjudicating those incidents as justified or unjustified. At a high level, the system needs historical information on the types of incidents the department wants to detect and prevent, as well as incidents that the department does not want to flag as adverse.
- Demographic and behavioral data on police officers spanning 3+ years: In addition to the outcomes (adverse incidents), the data-driven EIS also needs information about officers that are used to predict their future behavior. This officer information often includes demographics of the officers and their activity history (stops, dispatches, arrests, complaints, compliments, investigations, etc.). The data-driven EIS then takes these characteristics as input and develops predictive model to predict risk of future adverse incidents.
- Capacity/Amount and Type of preventive interventions accessible the the department: A major benefit of data-driven EIS is the ability to tune it for different intervention types and capacities. Knowing what types of interventions are available in a police department and the number of officers that could be provided those interventions allows us to optimize the EIS predictions for those interventions.
2.6 Benefits of DSaPP’s Data Driven EIS
By using all of the data available to a police department (HR, internal affairs, dispatches, arrests, stops, etc.), a data-driven Early Intervention System can enable police departments to:- Decrease adverse police interactions with the public
- Target limited resources on the officers that most need support
- Allows the department to determine at what efficiency or coverage they want to conduct interventions based on availability of the intervention (prioritize coverage for lower cost interventions and efficiency for higher cost interventions)
- Reward low-risk officers (even if they are high activity) and model their behavior
- Evaluate the effectiveness of existing interventions and develop new interventions based on the risk factors for their officers.
- Identify the risk of various incident types (beyond adverse incidents in general)
- 3 Historical Evaluation of SFPD’s EIS
The first goal of our work was to evaluate the performance of SFPD’s EIS based on the two metrics (coverage and efficiency) using historical data we received. This section describes our understanding of the SFPD EIS, the data we received, our evaluation methodology, and results.
3.1 SFPD Data
Our data-driven EIS needs two types of data:- Inputs: Data about officers (HR, demographics, history) and their activities (stops, dispatches, arrests, etc.).
- Outputs: Incidents that could be considered “adverse”, such as those investigated by IAD/OIS and the rulings/decisions on those investigations. It is important to have both of these sets: incidents investigated, and incidents determined to be adverse since the EIS. If we only provide the system incidents that were investigated (but not the outcomes of the investigations), the EIS will flag officers at risk of all of those incidents, instead of the just the ones that were determined to be adverse.
The farther back in time this data goes, the more confident we can be in the performance of the data-driven that is built. In our work with SFPD, we found that a lot of data that was captured was not at a fine-grain level, both in terms of time (data aggregated by month for example), and in terms of officers (not stored at an individual officer level).
The last data refresh we received from SFPD was in December 2017 and since IAD/OIS investigations typically take up to 12 months, we only have reliable outcomes data for incidents that took place earlier than January 2017. This can be seen by looking at Figure 2 that shows the number of adverse incidents (investigated by IAD/OIS in blue, and ruled as adverse in Orange) in the 12 months following the month shown in the Figure.
3.2 How does SFPD’s EIS work?
Based on the data we received, we identified two distinct phases the SFPD EIS program has gone through: one that ended in 2015, and one that has been running since 2016. We will concentrate in the second phase, which we will name as EIS Sergeant. Before describing the second phase, we provide some statistics about the first phase. From January 1, 2010 to February 1, 2015 the EIS generated 1946 alerts, of which 165 were correct (overall efficiency of 8.5%). This translates to 74 distinct officers correctly identified from 431 flagged (officer identification efficiency of 17.2%).During both of these phases, SFPD’s current EIS has been threshold-based, monitoring several performance indicators and issuing an alert for officers who meet any of the following thresholds:
- a new shooting or weapon discharge
- 3 or more uses of force within a 3-month period
- 3 or more OCC complaints within a 6-month period
Image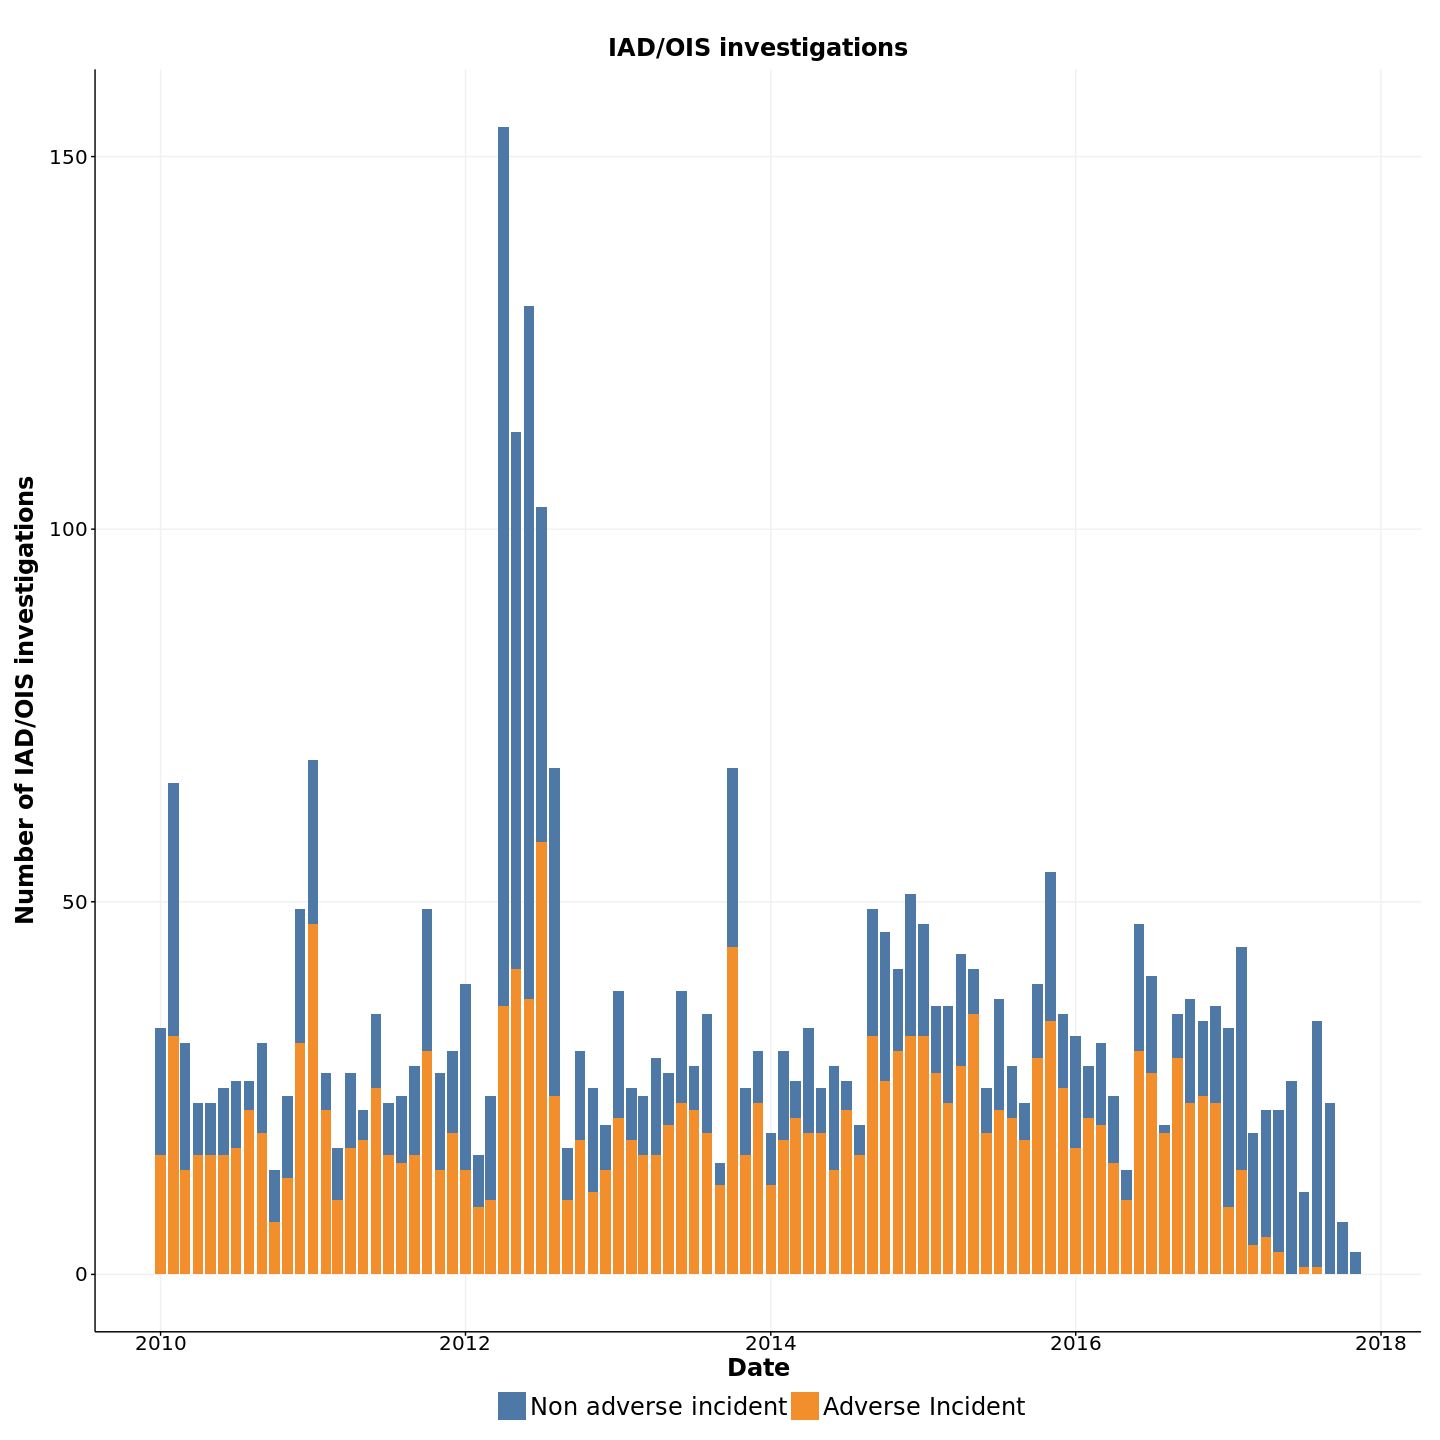
Fig 2. Number of Internal Affairs Department (IAD) and Officer Involved in Shooting (OIS) investigations per month. The color indicates if the final ruling was “adverse”, i.e. “sustained”, “preventable” or “unjustified” (orange) or not (blue). Downward trend at the end of the period is because not enough time has passed for incidents because investigations take 12 months and our last data refresh was December 2018, resulting on small number of closed IAD cases during 2018. - 5 or more indicators4 within a 6-month period
- 4 or more OCC complaints within a 12-month period, or
- 6 or more indicators within a 12-month period.
The AIM alert system generates alarms every month, but those alerts are combined and duplicates are filtered before being presented to the EIS Sergeant every two months.
Image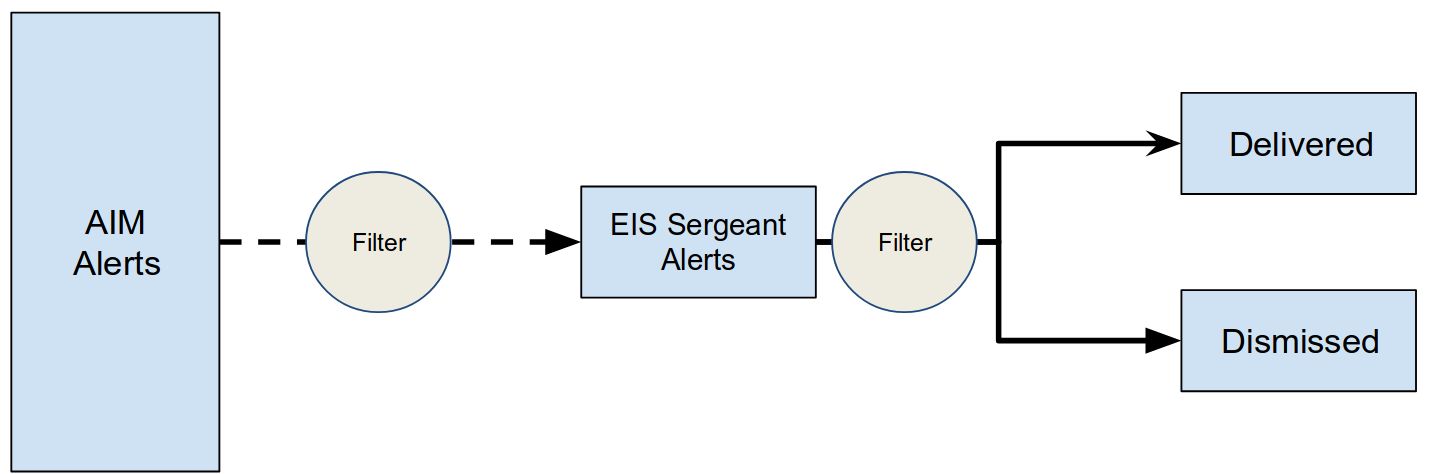
Fig 3. EIS Alert Process (Jan 01 2016 - July 01 2017) Many departments automatically send Threshold EIS alerts to the officer’s supervisor, but SFPD’s current EIS program uses a two-stage process: the automated threshold-based system (AIM) generates alerts, then the EIS Sergeant reviews and filters those to create final alerts. The Sergeant dismisses some alerts after reviewing the officer’s past behavior and concluding that no adverse behavior pattern exists and sends the remaining alerts to the officer’s supervisor for review. This additional human step adds expert knowledge to the process, and is supposed to increase the accuracy of the alerts sent to supervisors. Our analysis finds that this additional review step does not increase the efficiency or coverage of the EIS. We evaluate the performance of this filtering step as well and show results in the next section.
4 The indicators are officer-involved shooting, officer-involved discharge, use of force, OCC complaint, IAD investigation, Equal Employment Opportunity complaint, civil suit, tort claim, on-duty collision, and vehicle pursuit.
3.3 Performance of SFPD’s EIS
Similar to most police departments, SFPD had not done a quantitative evaluation of the existing EIS program. Phase One of our analysis was focused on evaluating the existing system. We evaluated the performance of the entire EIS process (Threshold EIS with the EIS Sergeant review) as well as of each of the components separately to better understand the effectiveness of each step. Fig 4 shows the metrics of the EIS before the filtering by the EIS Sergeant.Fig 4 Left) Efficiency and Right) Coverage of the Threshold EIS before the EIS Sergeant filters them. In blue are the number of correct alerts per month, i.e. those alerts that flagged an officer who will have an adverse incident in the 12 months following the alert. The gaps indicate months where no alert data was provided. EIS Sergeant Alerts (2016): Efficiency EIS Sergeant Alerts (2016): Coverage Image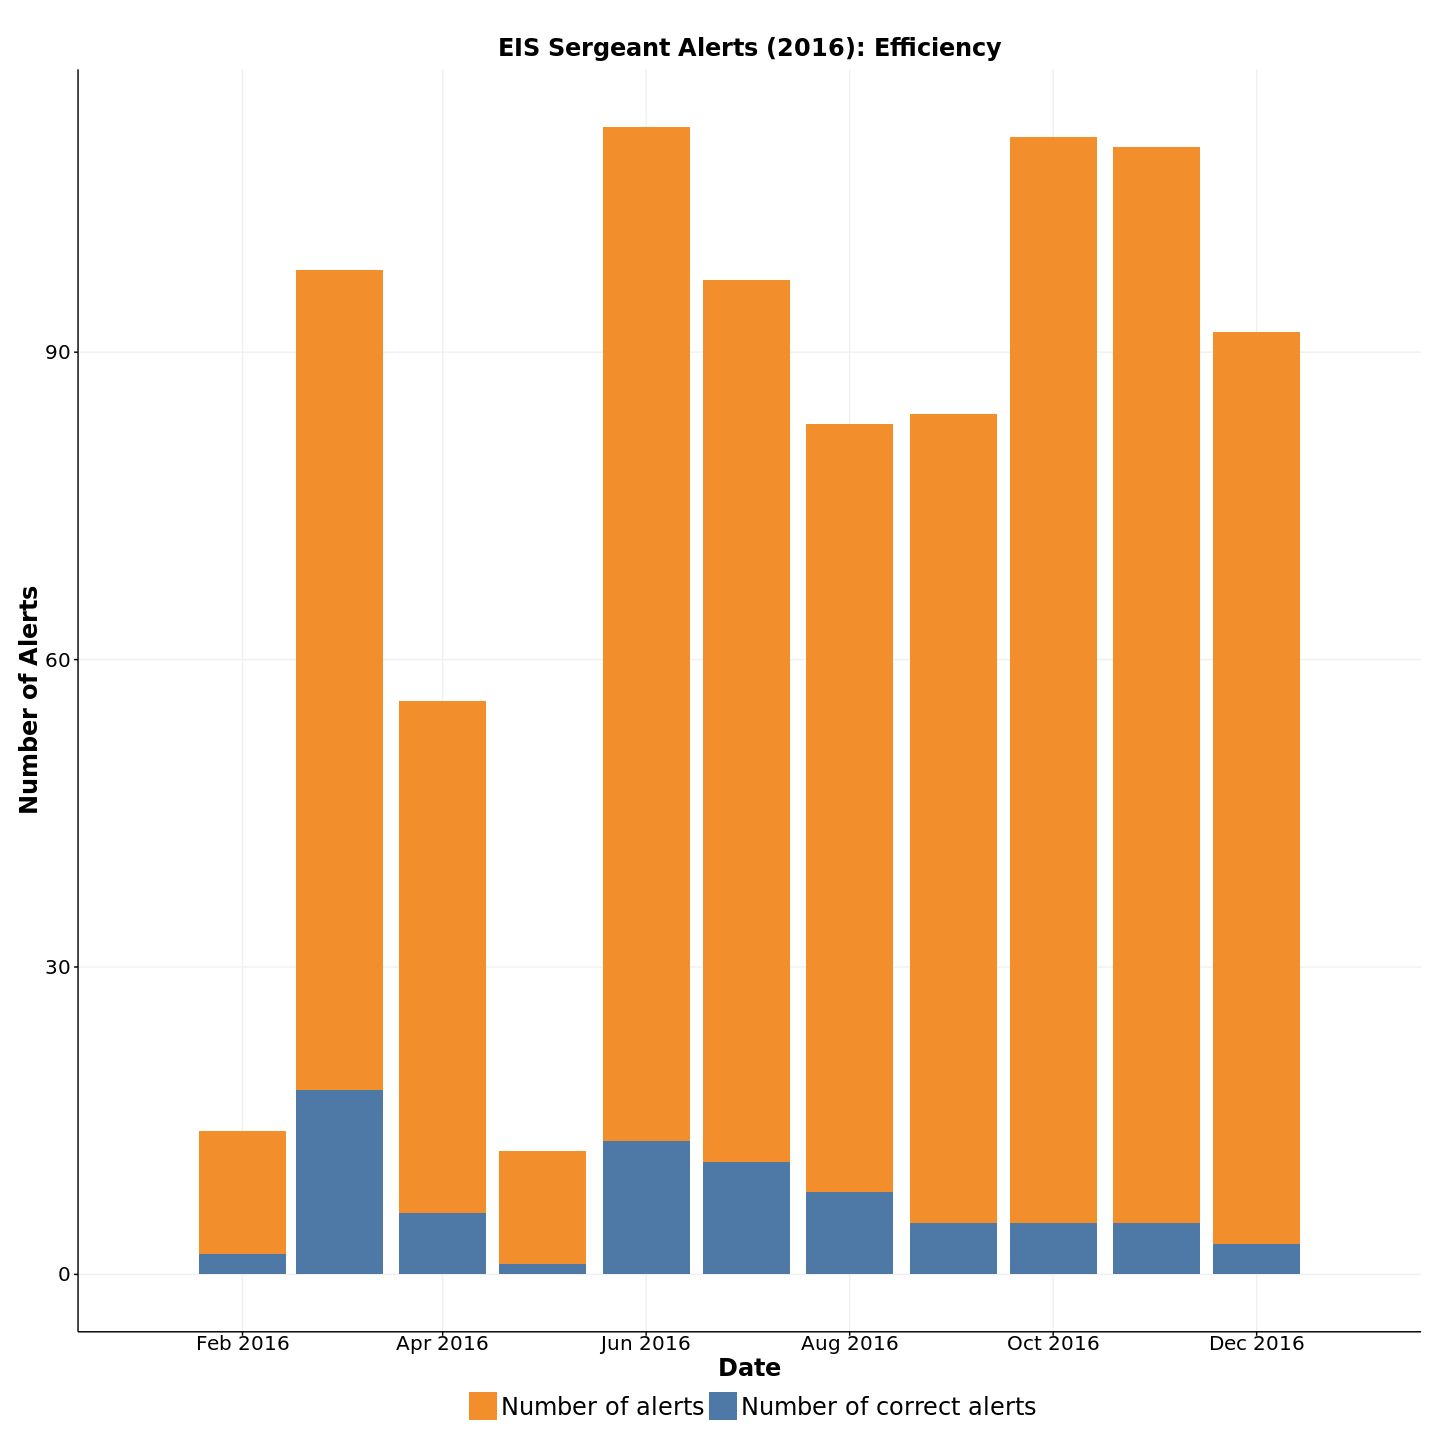 Image
ImageFigure 5 shows the metric after the EIS Sergeant does the filtering. It is noteworthy to check that the number of alerts decreases considerably: From an average of almost 100 alerts every month, to 60 on average.
Fig 5. Left) Efficiency and Right) Coverage of the Threshold EIS after the EIS Sergeant filters them. In blue are the number of correct alerts per month, i.e. those alerts that flagged an officer who will have an adverse incident in the 12 months following the alert. The gaps indicate months where no alert data was provided. EIS Sergeant Delivered Alerts (2016-2017): Efficiency EIS Sergeant Delivered Alerts (2016): Coverage Image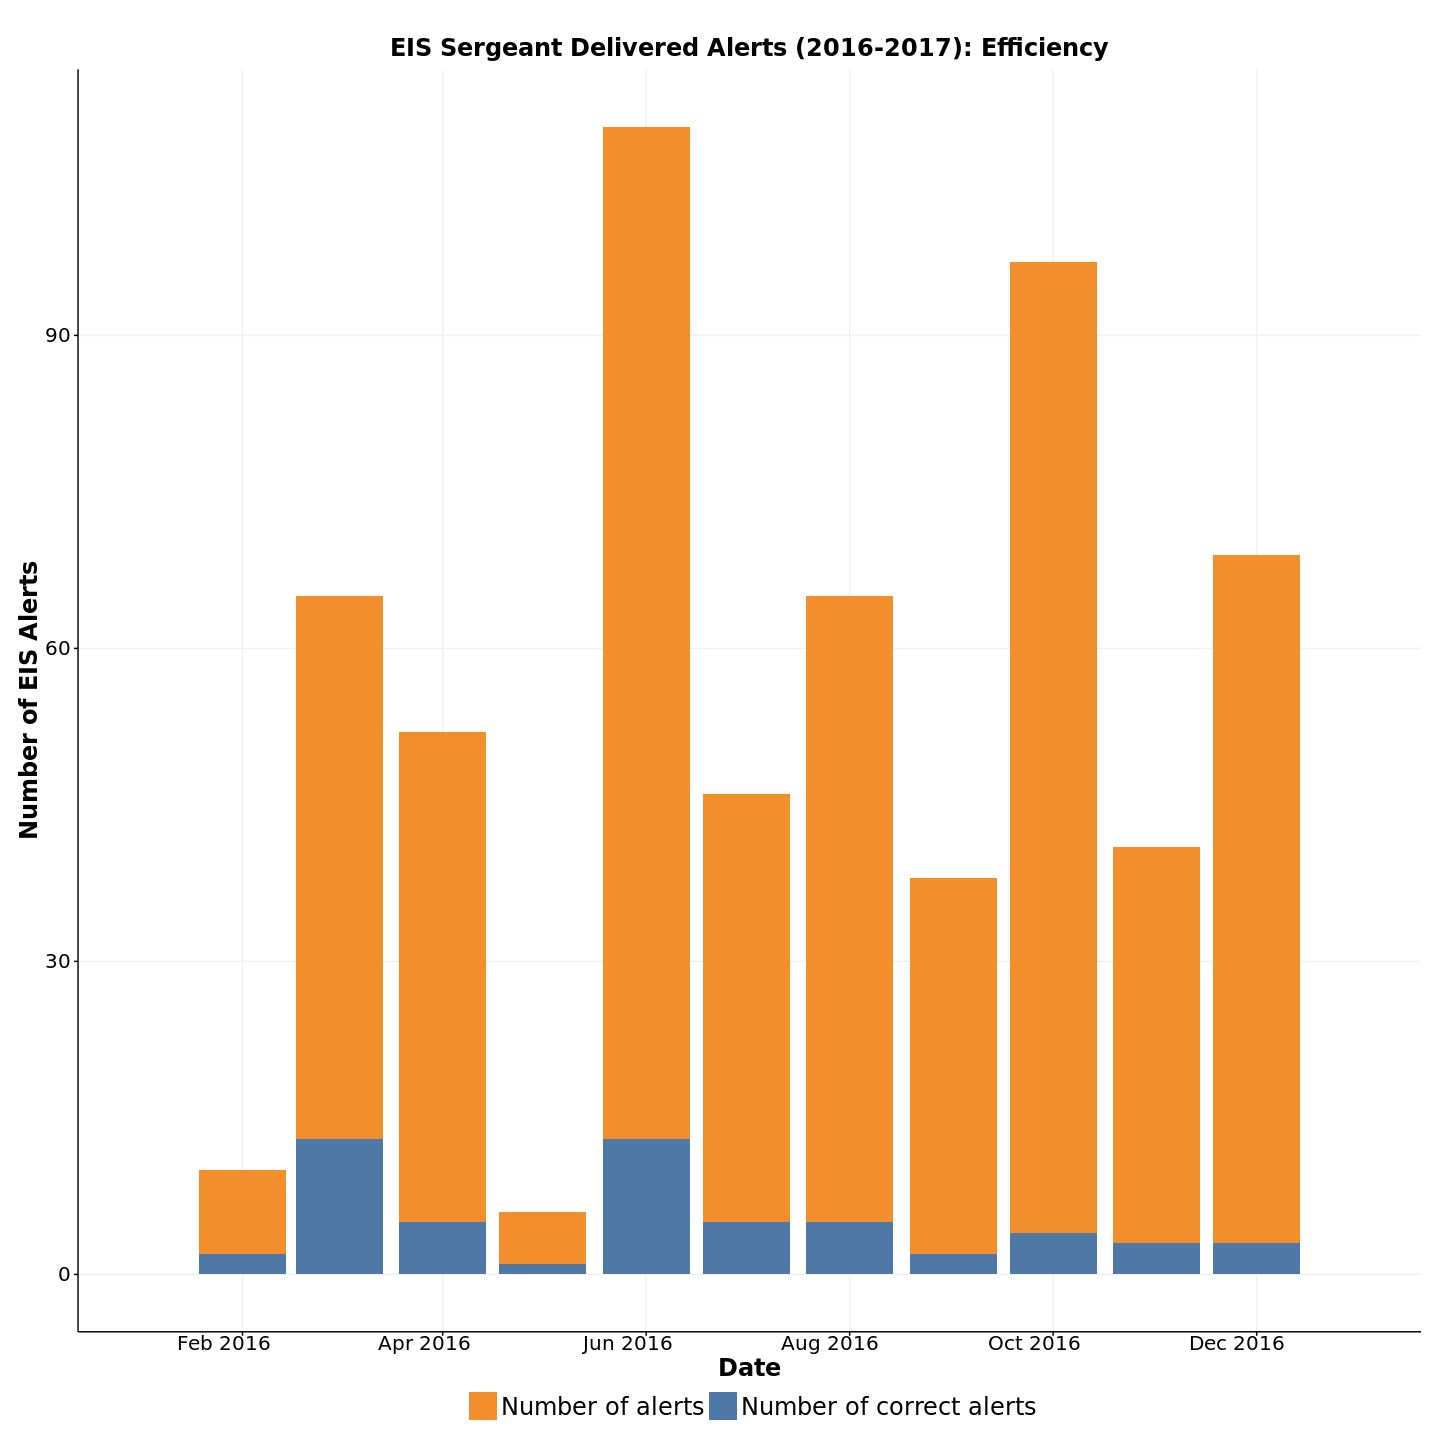 Image
Image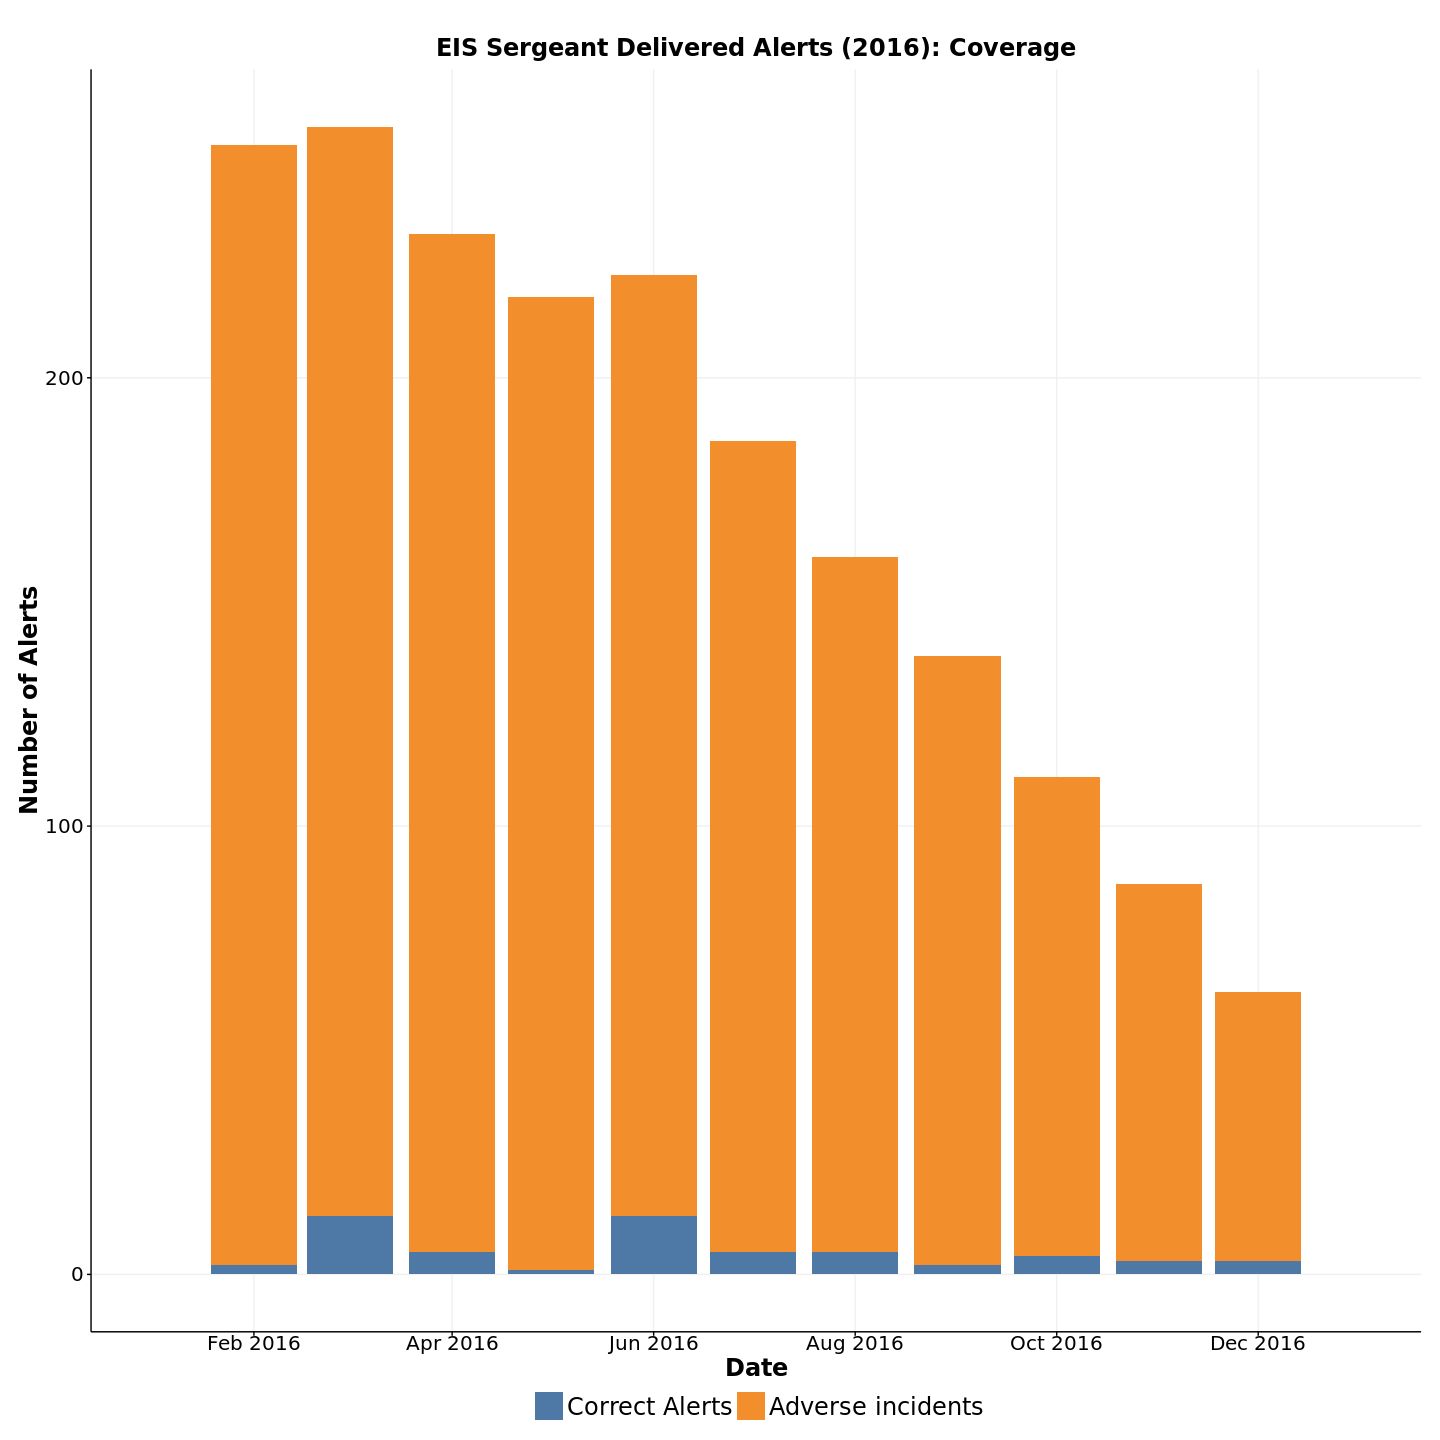 Image
Image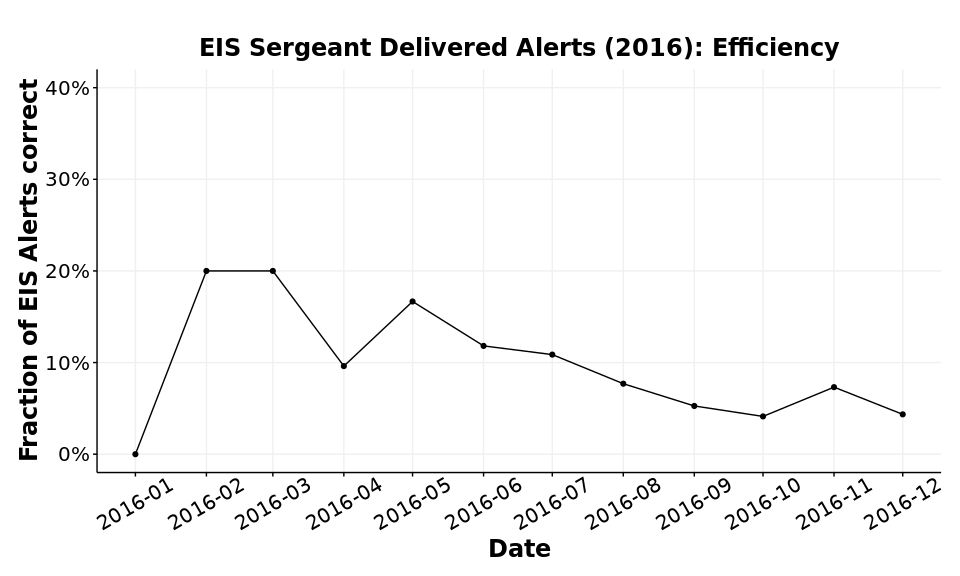
Fig 6 Efficiency plot of the SFPD EIS threshold system. The difference between this plot and the Fig. 7 is that this shows the quotient (the formula shown before) and not the raw values (number of alerts vs number of correct alerts). 3.4 The effect of the filtering by the EIS Sergeant
Table 2 summarizes the SFPD EIS before and after the filtering of the EIS Sergeant. We can observe that the review process, currently being performed by the EIS Sergeant, reduces the number of flags generated by the EIS program, but does not result in more efficiency. The same percentage of flags are correct, before and after the review process, leading us to believe that the review process is essentially random, and not increasing the efficiency of the program. We believe that there is significant potential in improving this Sergeant review process.Table 2. Comparison of the SFPD EIS before and after the EIS Sergeant filtering SFPD EIS System Without filtering After filtering (Only delivered alerts) # Alerts Generated 1333 941 # Correct Alerts 86 61 % Correct Alerts 6.5% 6.5% # Unique Officers Flagged 395 385 # Unique Officers Flagged correctly 35 32 % Correctly identified officers 8.9% 8.3% 3.5 Effect of Considering Pointing of Firearms as a Use of Force Incident:
A specific analysis we were requested to do was to evaluate the effect of treating Pointing of Firearms (POF) as a Use of Force incident on the per of thformancee the SFPD EIS. The number of alerts being generated by the EIS has increased substantially since Pointing of Firearm was determined to be a Use of Force incident. Our analysis showed that 76% of the delivered alerts are due to POF but their efficiency (percentage of those alerts that flag officers who go on to have adverse incidents in the next 12 months) is lower than that for alerts generated for non-POF reasons. The efficiency of POF alerts is ~5% while the the accuracy of non-POF is 14%. Removing POF from the alerts will increase efficiency to 14% (while reducing the number of officers found) but this number is still lower than the DSaPP data-driven EIS (described in the next section).3.6 Challenges with the existing SFPD EIS Program
Based on our discussions with SFPD and our empirical evaluation described above, we find that SFPD’s EIS Program faces several challenges:- The existing SFPD EIS (combined decisions based on the threshold-based triggers and the Sergeant review) is highly inaccurate, with ~8% of flagged officers actually going on to have adverse incidents in the next year.
- The review process, currently being performed by the EIS Sergeant, reduces the number of flags generated by the EIS program, but does not result in more efficiency. The same percentage of flags are correct, before and after the review process, leading us to believe that there is potential in improving this Sergeant review process.
- The EIS lacks legitimacy among many officers and supervisors. They believe the EIS Program incorrectly focuses on active officers who are simply active in doing their jobs, rather than on officers who are exhibiting risky or inappropriate behavior. Some officers take pride in receiving alerts because they feel alerts indicate hard work.
- Because the alerts are seen as illegitimate, the resulting paperwork required to address each alert feels like a burden and creates resentment.
- Since January 2016, when “Pointing of Firearm” became a reported use of force, the Sergeant Reviewed EIS alerts grew 200% (from 50 alerts every two months on average before 2016 to 150 alerts every two months in 2016). This high volume of alerts has strained the EIS Sergeant’s ability to review each alert.
- Supervisors rarely act on the alerts produced by the current EIS Program, which means at-risk officers likely do not receive the support intended by the program.
- 4 DSaPP’s Data-Driven EIS
4.1 How does it work?
Over the last several months, the DSaPP team used SFPD data and developed a data-driven EIS prototype for SFPD. The prototype uses machine learning to analyze thousands of variable combinations (e.g. related to traffic stops, arrests, use of force, compliments, dispatches, IAD interventions, training) over time to determine which factors best identify officers at risk in the near future.The output of the DSaPP EIS is a list of all active officers ranked from highest to lowest risk. The department has the ability to choose how many officers the EIS should create alerts for. At one extreme, it can issue no alerts, which eliminates false positives (officers who received alerts but did not go on to have an adverse incident) but also fails to alert on any officers who need early intervention. At the other extreme, it can alert on all officers, which would correctly identify all the officers who need early intervention (100% coverage) but also alert on all the officers who don’t.
The risk score of for an officer is highly contextual and changes over time, depending on the underlying data, the officer behavior, and the situations they have been exposed to recently. It is important to note that our risk score is used to rank and prioritize officers for interventions and does not does not represent a probability. For that reason, our generated list provides the risk rank of an officer instead of an actual score. Our system optimizes for the intervention capacity of each type of intervention and department. For the results shown in this report, we vary the intervention capacity to match the number of alerts that were being generated by the existing EIS but also run some analysis showing the impact of flagging more or fewer officers.
4.2 How well does it perform?
Before showing the results of the data-driven EIS prototype built of SFPD data, it is important to note that the evaluation and comparison results we present here are limited, primarily due the lack of consistent and historical data on officer activities, compared to other systems we’ve implemented in Charlotte-Mecklenburg and Nashville. The Recommendations section goes into more details of our recommendations on how to improve the data collection process to build a more effective data-driven EIS.There are two main takeaways from our evaluation of the current DSaPP prototype:
- Despite the lack of available consistent, historical data, our prototype achieves similar efficiency while issuing fewer alerts than the existing EIS system (based on AIM + EIS Sergeant review). Based on the average number of alerts triggered in the first and second phase of the current SFPD EIS, we studied the performance of our data driven EIS at two points to match the number of alerts raised by the existing system: (a) generating alerts for the 50 highest risk officers every three months(DSaPP@50) and (b) generating alerts for the 25 highest risk officers every three months (DSaPP@25). Based on those alerts, we calculate the efficiency and coverage of the system DSaPP@50 if it had been operational from January 2015 to January 2017. We do not have EIS alert data from SFPD for 10 months in this window for March to December 2015. If we exclude 2015 from the evaluation of our prototype, DSaPP generates 250 alerts with 41 (16.4%) correct. The EIS Sergeant generated 658 alerts in the same period, of which 57 (8.6%) correctly identified officers that went on to have an adverse incident in the 12 months following the alert.This is 408 fewer alerts than the SFPD EIS, while only missing 16 of the alerts the SFPD EIS gets correct.5
Replacing the existing Threshold EIS with the data-driven EIS could significantly increase the overall efficiency of the EIS program while freeing the EIS Sergeant to focus on the most important cases. - Our prototype shows far less activity bias than the EIS Sergeant’s alerts. Many officers complained that the EIS Program issues alerts based on higher activity. To understand this complaint better, we compared EIS Sergeant alerts to officer activity and found a positive correlation. In the data-driven EIS, many of the highest-risk officers have relatively low activity levels, and many high-activity officers have relatively low risk, giving evidence that the data-driven EIS is better able to separate active officers from officers who are at risk of adverse incidents. Addressing the existing activity bias would help address the EIS Program’s legitimacy issues and potentially provide SFPD the opportunity to “model” high-activity, low-risk officers.
4.3 How did we build the data-driven EIS for SFPD?
Our data-driven EIS is built using four steps:- Define outcomes of interest
- Create predictors based on all the data we have access to for each officer
- Generate thousands of machine learning predictive models that use the predictors generated in step 2 to predict outcomes defined in step 1.
- Compare the predictive models on historical data on metrics of interest and select the best model to generate a list of at-risk officers.
Steps 1 and 2 have been described in detail earlier in this report. For step 3, we created 1,400 models based on various combinations of methods, data sets used (all of the predictors versus some combination of the predictors), length of history used (all the data available from any given data source, versus just one year or two, etc) and some specific parameters related to the modeling process (which algorithm was used, for example). We measured performance across all the models and selected two models: one that generates lists of 25 officers, every 3 months, named (DSaPP@25) , and one that generates lists of 50 officer every three months (DSaPP@50) to allow SFPD to intervene at different levels of capacity. In both cases we searched for models that performed well (high average efficiency value across time), were stable (low variance of efficiency across time), and allowed flexible levels of interventions at different sizes of the the list of officers generated (e.g. the model is also good in generating lists of 100 officers in addition to 25 and 50). The detailed performance of DSaPP@25 and DSaPP@50 are shown in Figures 12-17.
Table 3 shows the summary of the results for the two models, allowing us to see that the data-driven EIS can achieve 20%-22% efficiency while flagging 25-50 officers, a significant improvement over the 8% efficiency of the SFPD EIS, even with the additional EIS Sergeant review process. The next section will go deeper into the comparison between the results of the two systems.
Image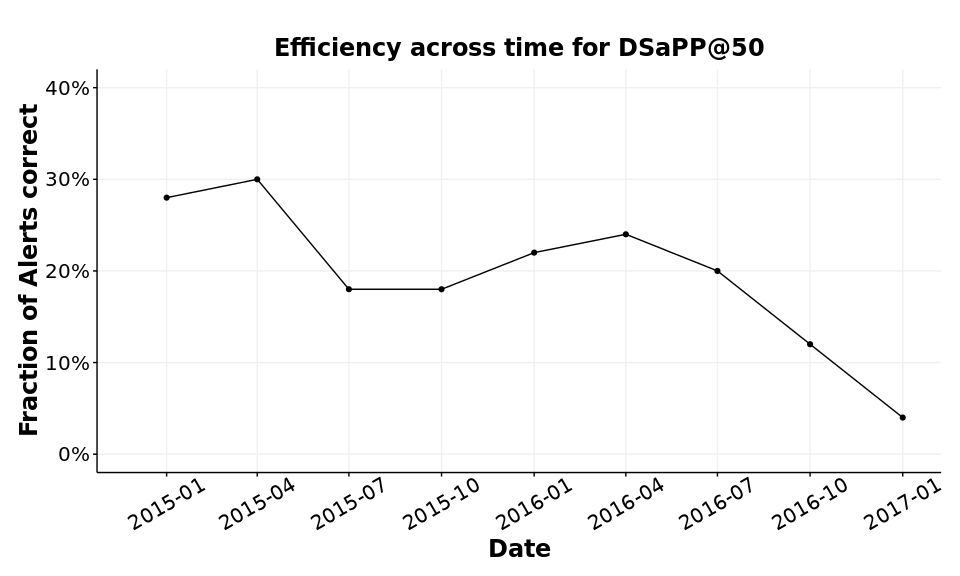
Fig 7. Efficiency plot for DSaPP@50 generating alerts every three months. Image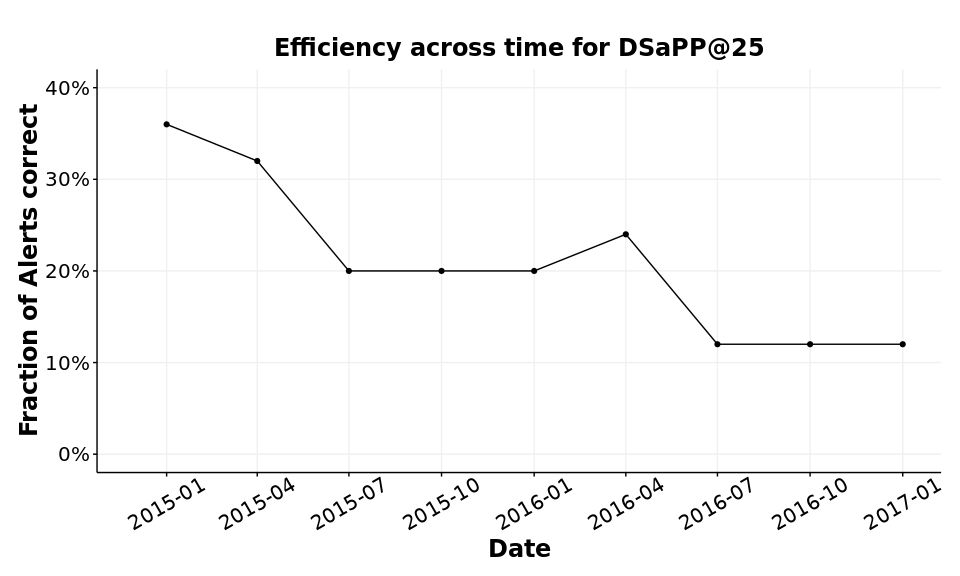
Fig 8. Efficiency plot for DSaPP@25 generating 25 alerts every three months. Fig 9. Number of correct alerts for DSaPP@50 compared to the number of officers that will have an adverse incident in the following 12 months after the triggering of the alert. DSaPP@50: Efficiency DSaPP@50: Coverage Image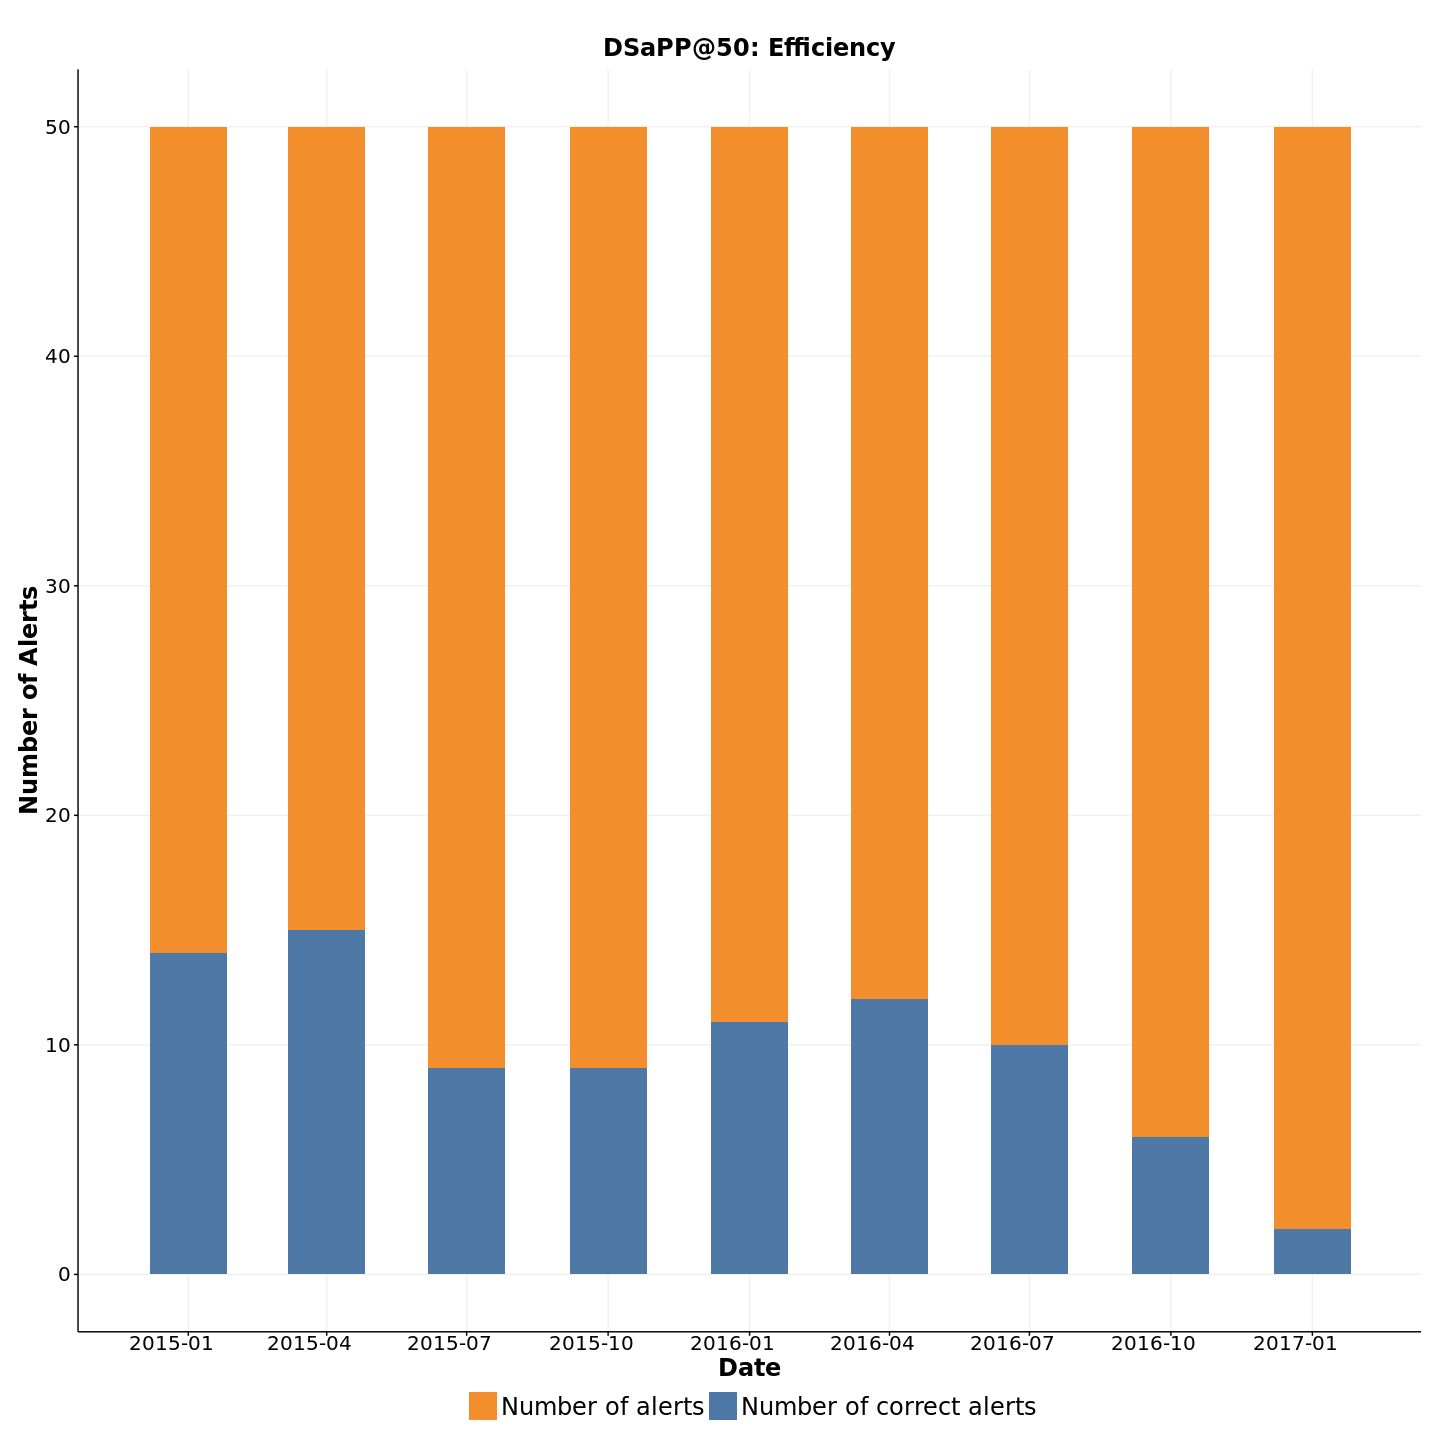 Image
Image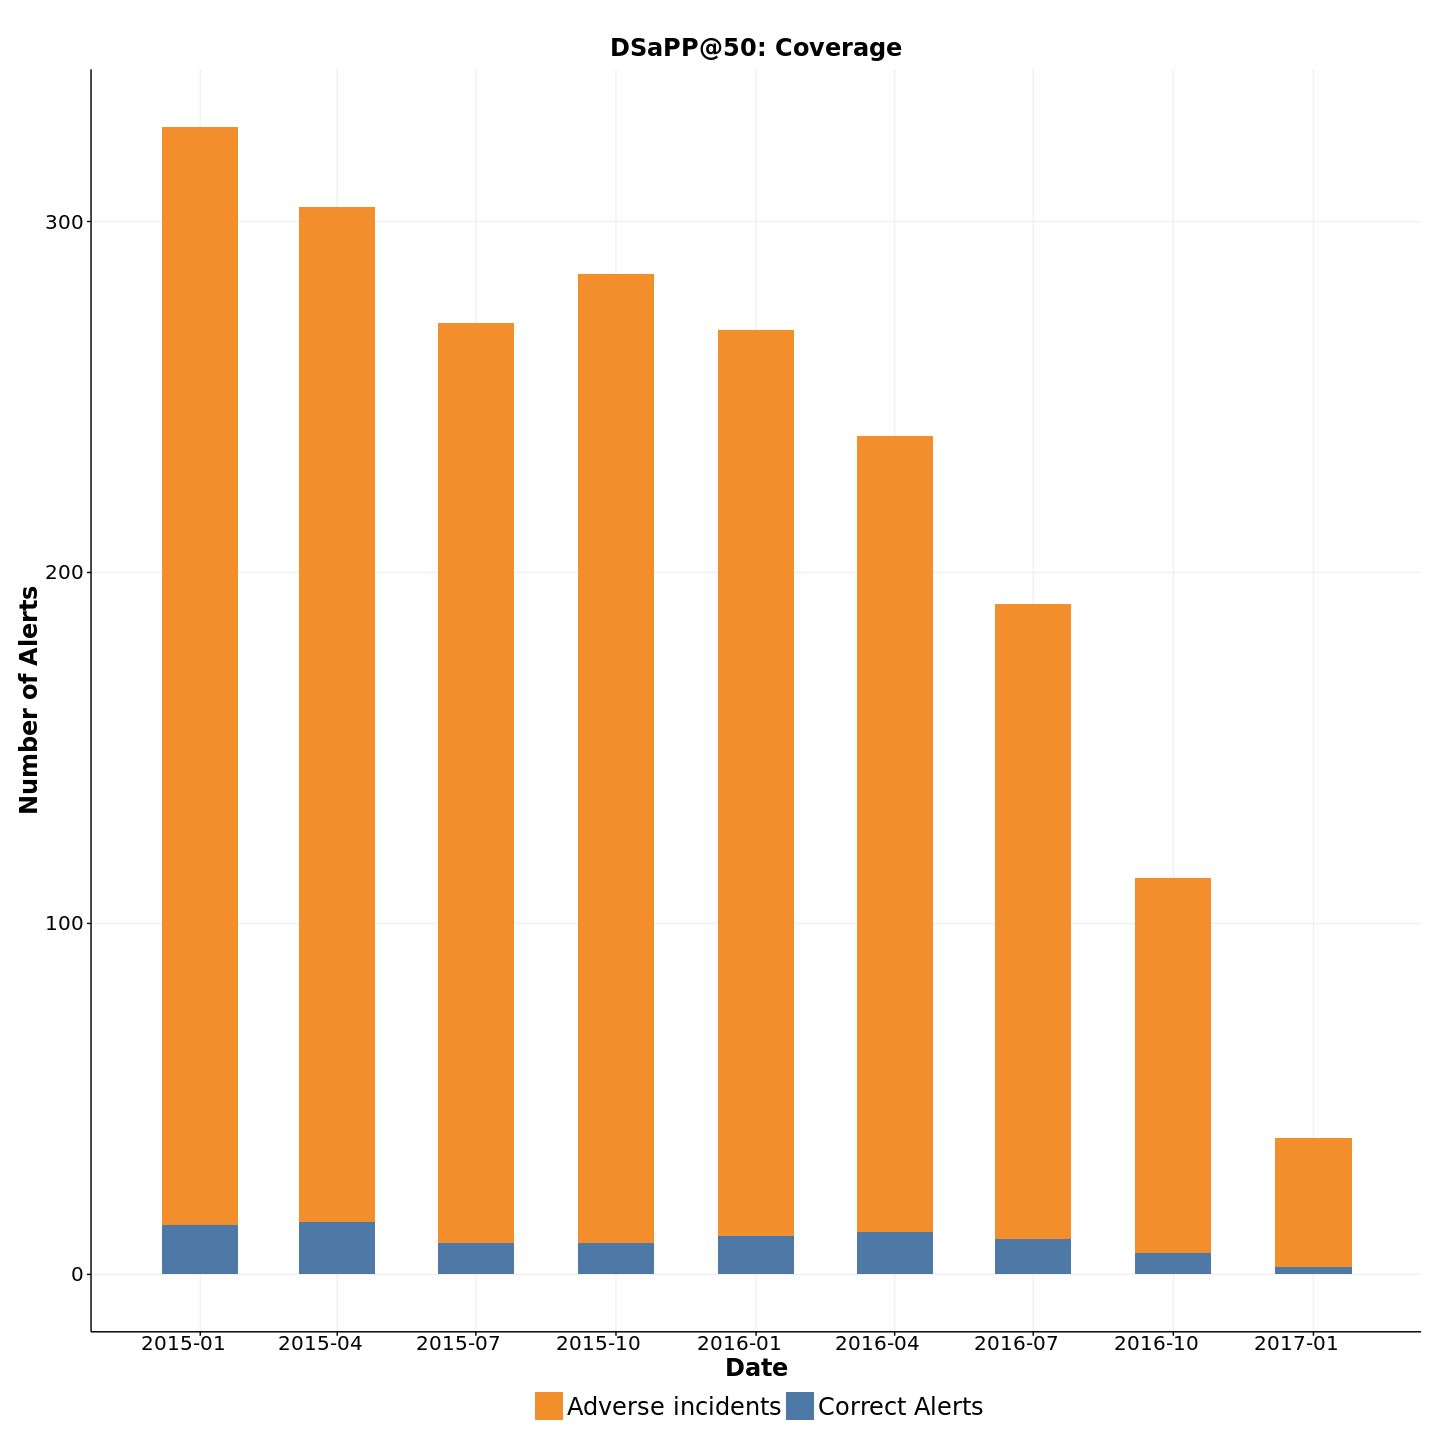
Fig 10. Left )Number of correct alerts every three months for DSaPP@25. Right) Number of correct alerts for DSaPP@25 EIS compared to the number of officers that will have an adverse incident in the following 12 months after the triggering of the alert DSaPP@25: Efficiency DSaPP@25: Coverage Image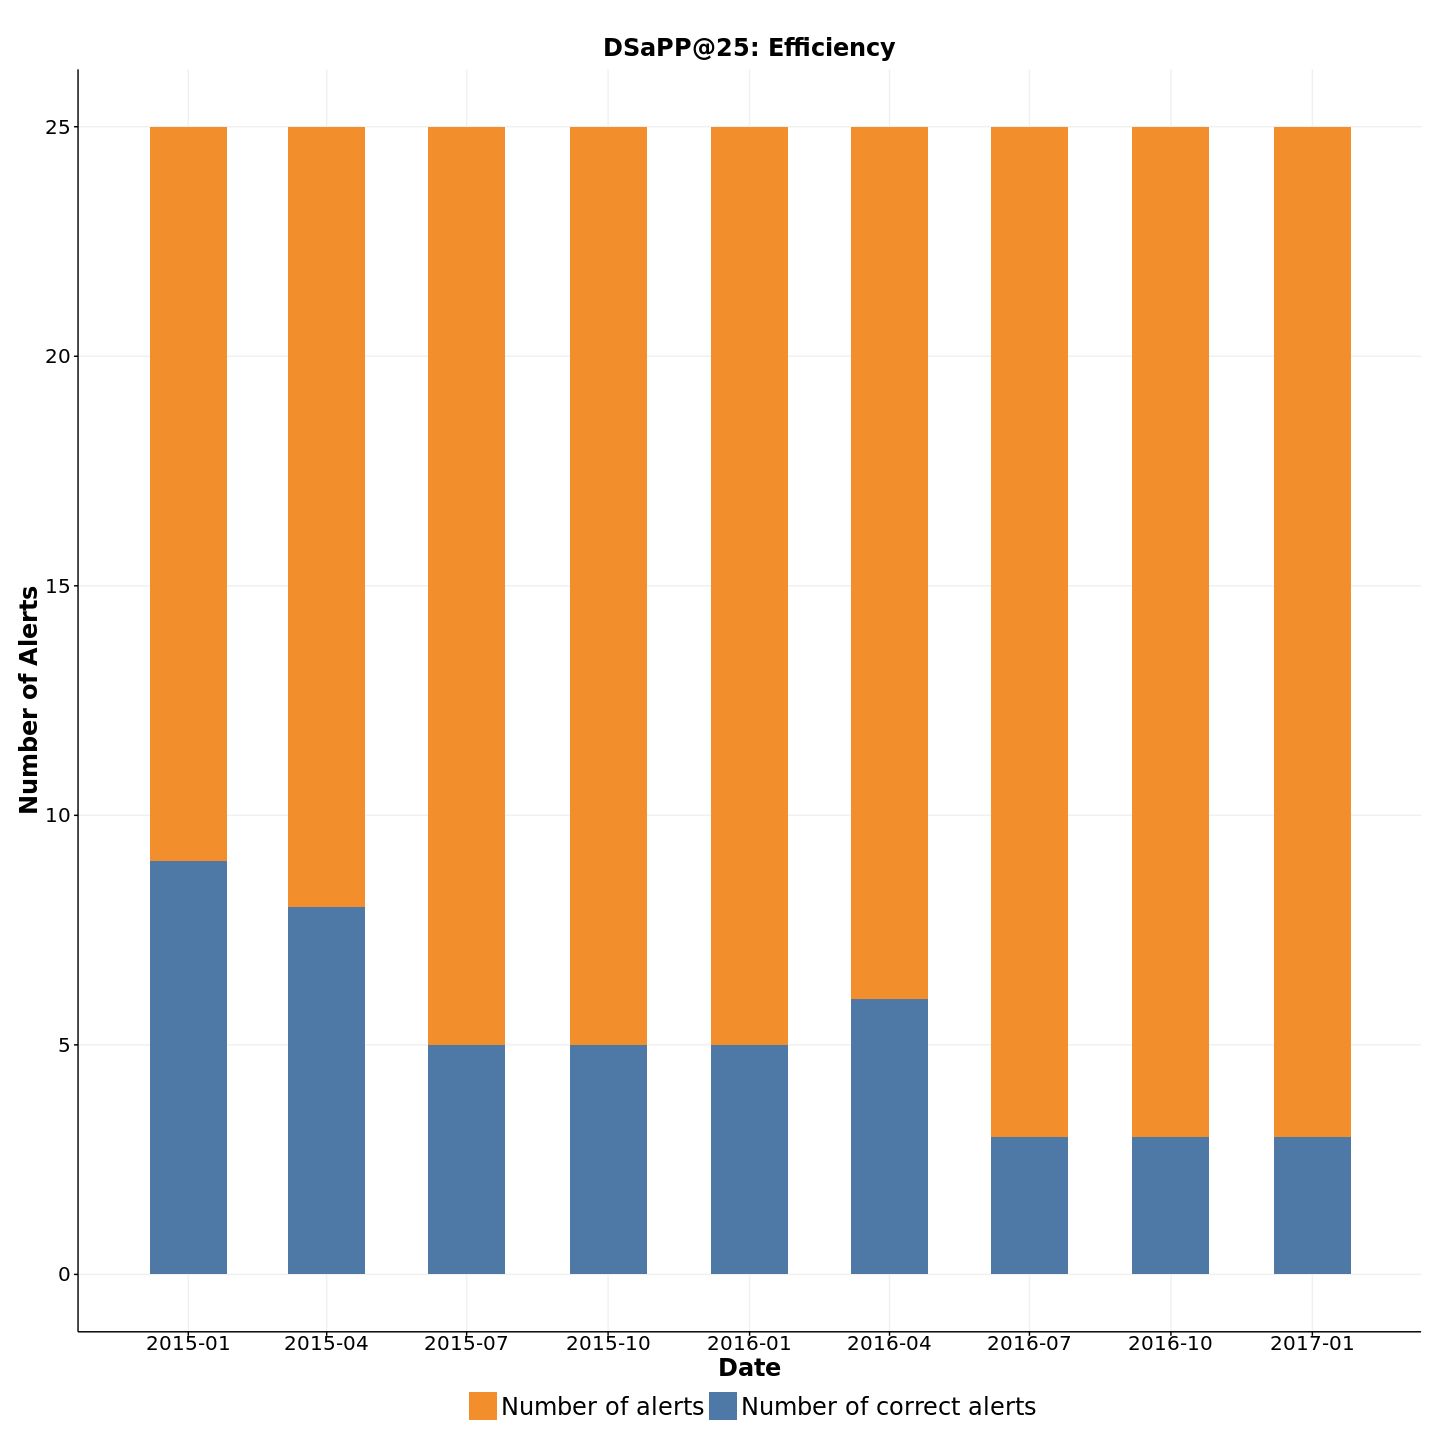 Image
Image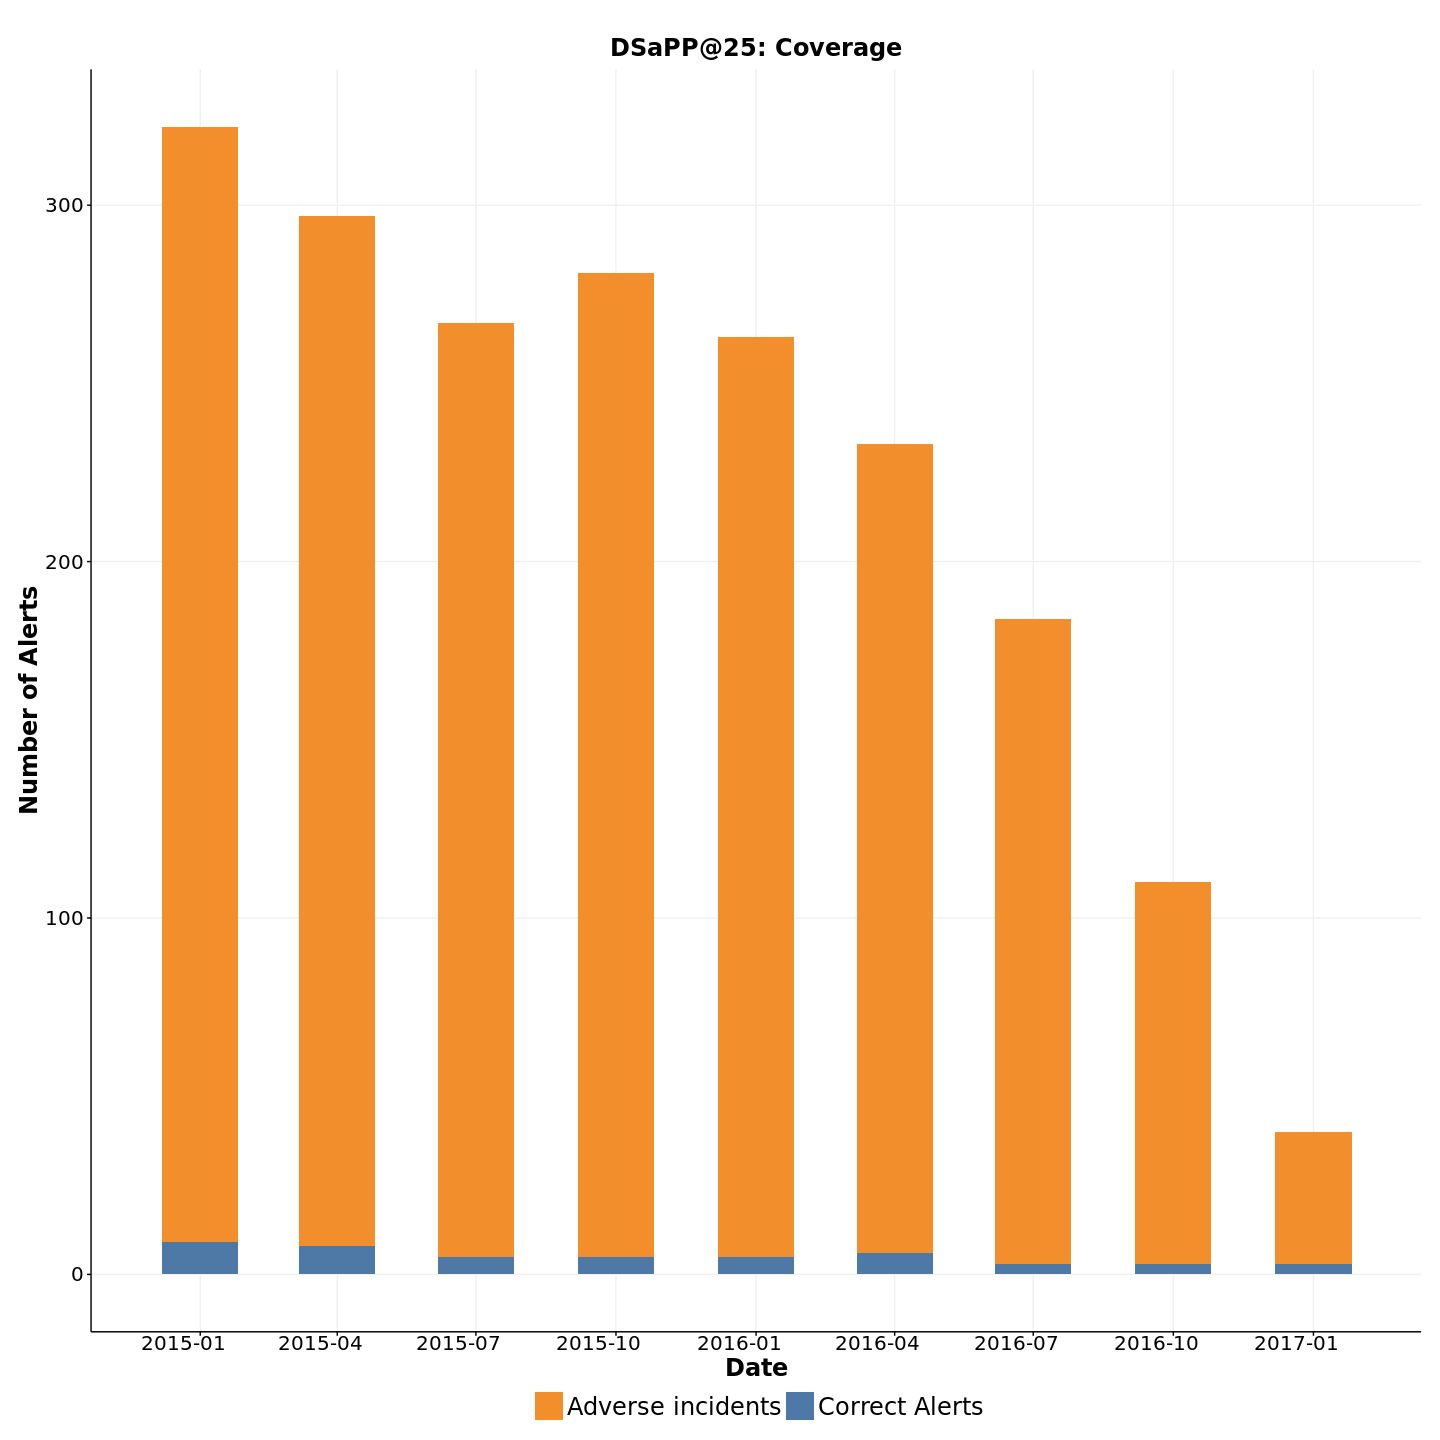
Table 3. Comparison between DSaPP@25 and DSaPP@50. Numbers shown belong to the period between January 2015 and January 2017 System DSaPP@25 DSaPP@50 # Alerts Generated 225 450 # Correct Alerts 47 88 % Correct 20.9% 19.7% # Unique Officers Flagged 153 266 # Unique Officers Flagged correctly 33 55 % Correctly identified officers 21.6% 20.7% 5 Our analysis shows that the DSaPP system generated 450 total alerts between January, 2015 and January, 2017, of which 88 (19.6%) correctly identified officers who went on to have an adverse incident in the following 12 months.
4.4 Comparing SFPD EIS Performance and DSaPP EIS Performance
As we compare the two systems, it’s important to remember that the performance of SFPD EIS includes the Automated Alerts augmented by the Sergeant review process while the DSAPP EIS does not have the additional human review process. We would expect the review process to increase the efficiency of the DSaPP EIS. Figure 11 show the process flow of the two systems.Image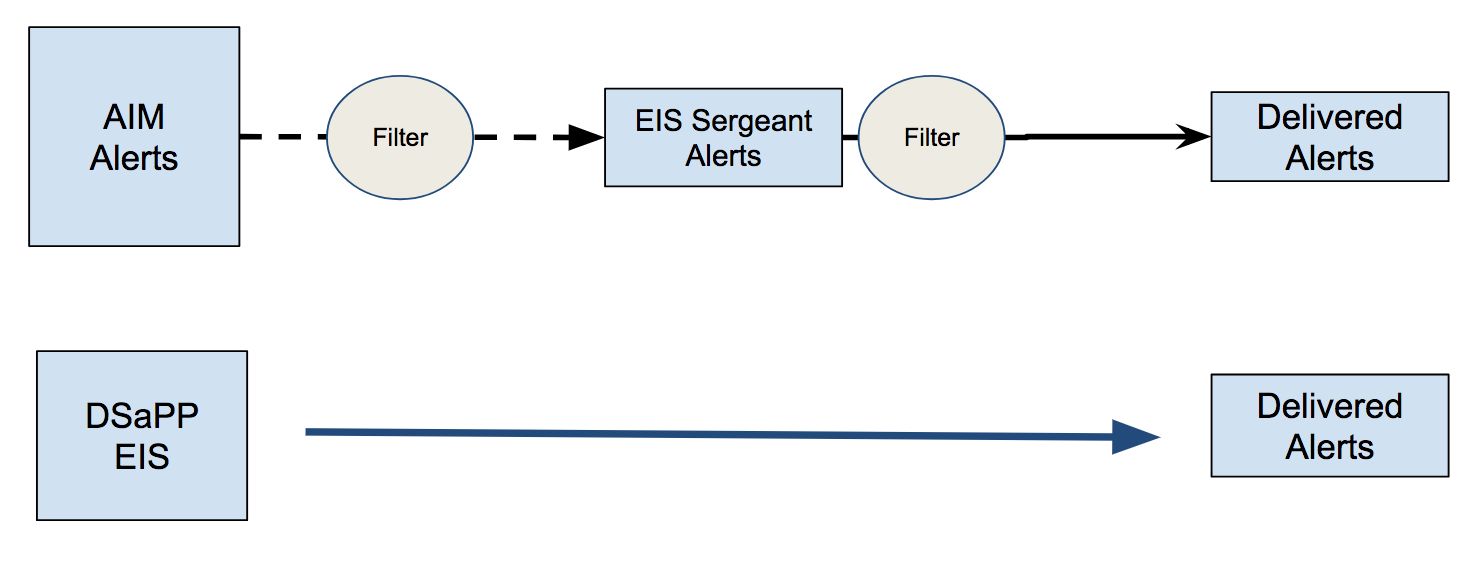
Figure 11: Process flow of the two systems. The existing SFPD Threshold EIS generates different number of alerts every month (roughly between 25 to 50 officers every month in the first phase and an average of 60 in the second phase, with some peaks of almost 100 alerts). The DSaPP EIS is flexible in the number of alerts generated and can be tuned to provide different number of alerts. We compared the performance of the two systems in a few different ways:
- How many more officers does the DSaPP EIS correctly identify if it generates the same number of alerts as the SFPD EIS?
As we can observe from figure X, DSaPP EIS is able to correctly identify significantly (2x-3x) more officers than the SFPD EIS when generating the same number of alerts for every quarter of 2016.
Image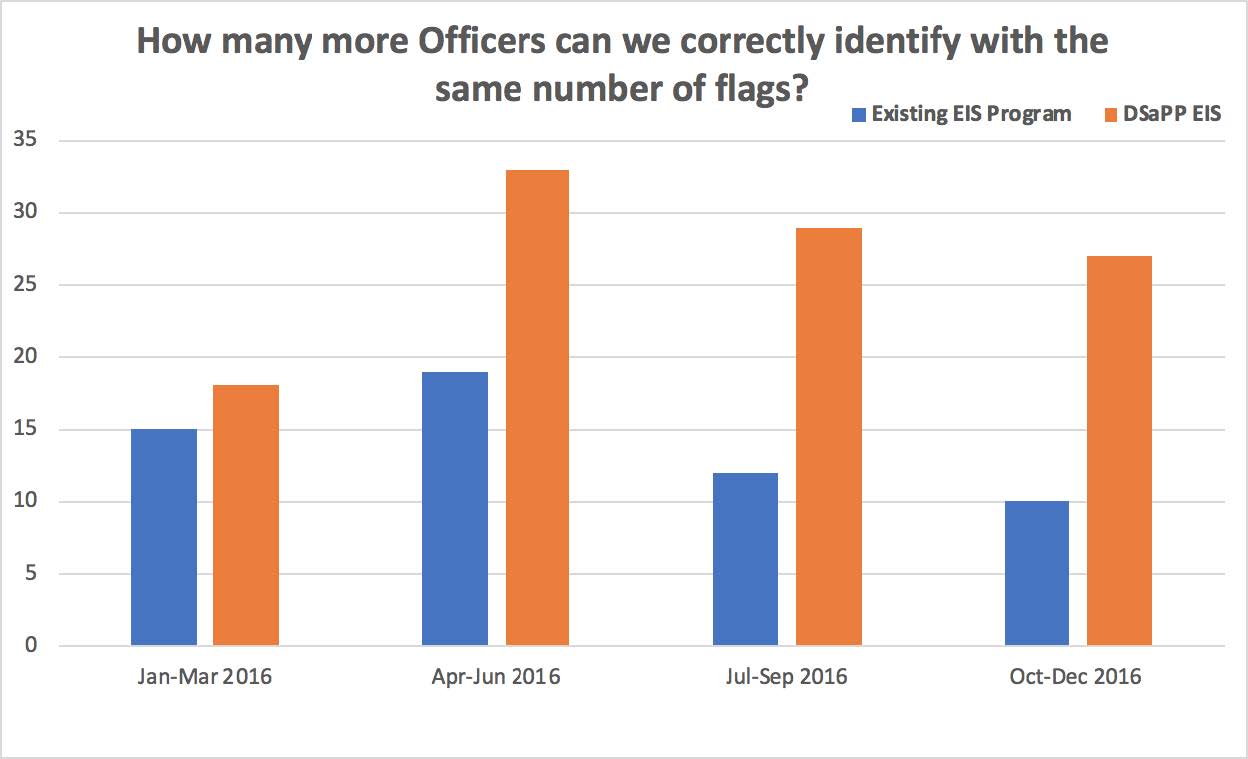
- How many fewer officers can the DSaPP EIS flag to correctly identify the same number of officers as the SFPD EIS?
If SFPD wanted to correctly identify the same number of officers as they are identifying now, the DSaPP EIS could reduce the number of alerts generated drastically (by as much as half) and achieve the same results.
Image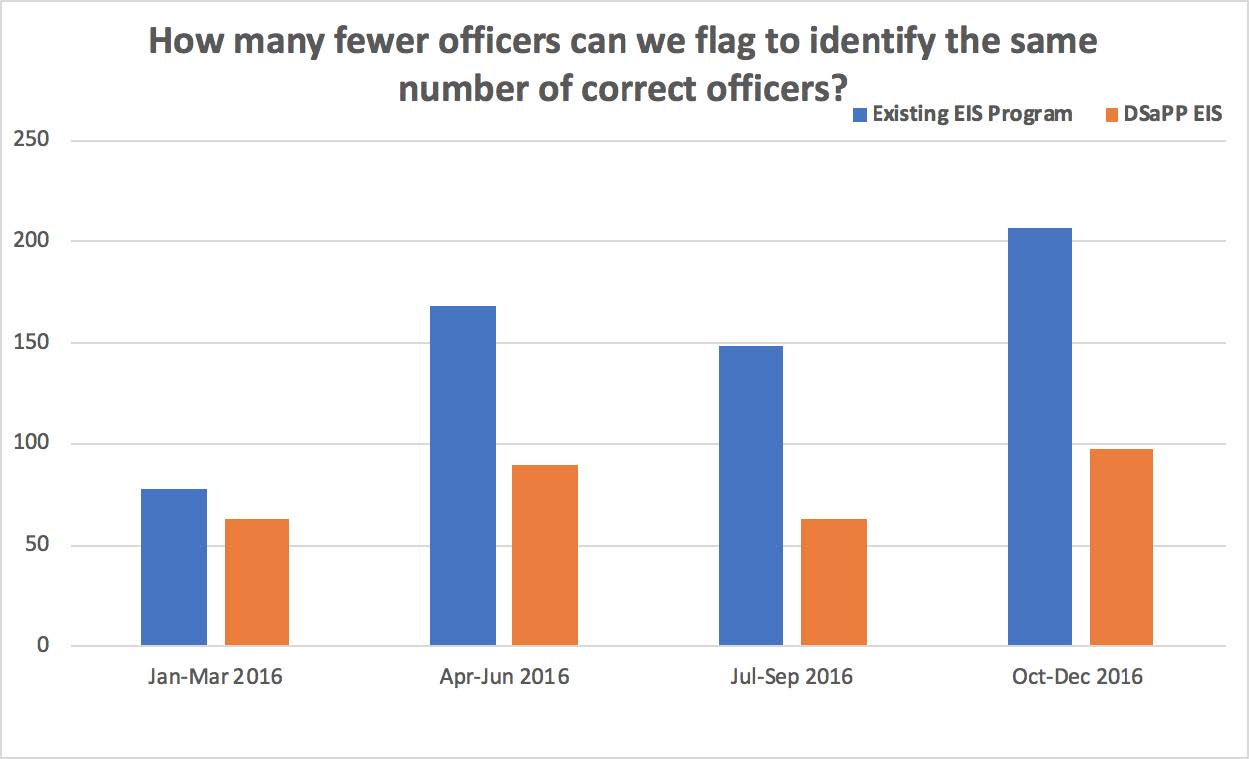
- What is the overall efficiency of the two systems at different number of officers flagged?
The figure below shows the overall efficiency of each system showing that the DSaPP EIS is 2- 3 times more effective compared to the SFPD EIS.
Image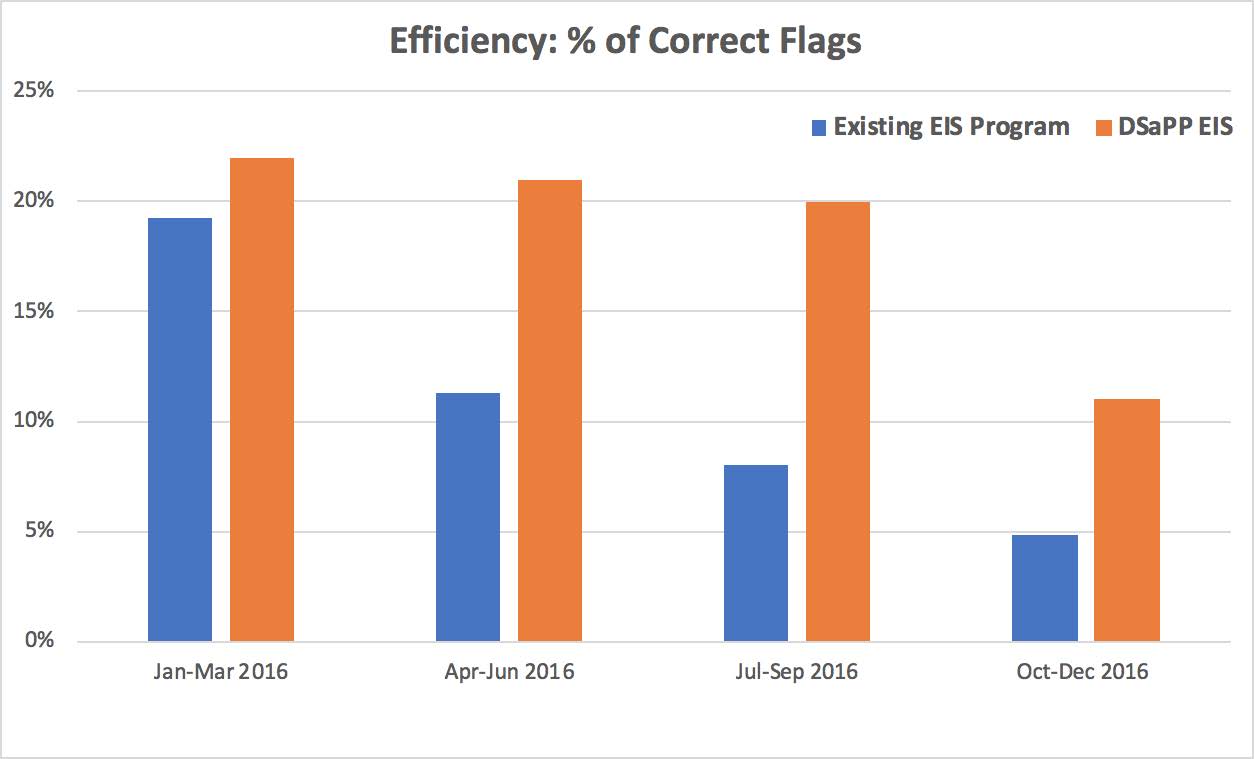
These results show that under a variety of use cases, the DSaPP EIS is more effective at identifying officers who are at risk of adverse incidents in the next 12 months. In addition to the numerical analysis of the results, we also did an analysis to understand the differences in the types of officers the two systems flag.
The table below shows the comparison of the characteristics of officers that are flagged as high risk by each of the systems: DSaPP Data-Driven System Existing SFPD EIS Flagged Officers are likely to have:
7x more closed IAD cases
5x more IAD Incidents
2.7x more EIS Alerts
2x more Arrests
2x more Recent Activity3x fewer Compliments
3x less Overtime worked
2.5x less Secondary Employment
2.5x less Sick Leave
1.5x fewer Vehicle PursuitsFlagged Officers are likely to have:
10x more EIS Alerts
7x more UOF Incidents
5x more Vehicle Pursuits
2.8x Arrests
2.4x more Recent Activity
1.3x Overtime worked3x less Secondary Employment
1.3x less Sick LeaveOur findings based on the differences shown above are that:
- SFPD EIS primarily flags officers based on historical EIS Alerts and Use of Force incidents compared to the DSaPP system that flags officers with more IAD incidents and closed cases.
- SFPD’s existing system is more activity-based than DSaPP’s system: it tends to flag officers with more vehicle pursuits, arrests, recent activity, and overtime worked, compared to the more nuanced DSaPP system (note the officers flagged with fewer vehicle pursuits and overtime worked).
The existing SFPD EIS and the DSaPP are not not only different in the percentage of correct flags but they also flag different types of officers. The existing EIS flags officers with high number of historical EIS Alerts and UOF incidents, and officers with more activity in general. The DSaPP EIS uses all the historical data to generate flags more accurately in a more nuanced manner, without relying purely on activity or historical EIS alerts.
4.5 Can a threshold-based EIS be improved using data?
On SFPD’s request to understand whether their threshold-based EIS could be improved using historical data, we built an additional EIS prototype that used historical data to determine the triggers and thresholds. This system takes the threshold type triggers that the existing SFPD system uses but determines the trigger events and thresholds using the data we have access to. SFPD requested this to understand the best possible performance any threshold based system can achieve, even if it’s data-driven.We compared the performance of this Simple Rule (DSAPP-SR) EIS to the current EIS in two ways: (1) The DSaPP-SR system triggers the same number of flags as the existing EIS and (2) The DSaPP-SR system correctly identifies the same number of officers as the existing EIS. In the first scenario the difference between systems will be the number of correctly identified officers, and in the second, the difference will be in the number of triggered alerts:
Table 2. Number of correctly identified officers who go on to have an adverse incident if both systems triggered the same number of alerts. Compares the SFPD EIS after the EIS Sergeant filtering and the DSAPP Simple Rules. Existing EIS program DSaPP - SR Jan-Mar 2016 15 9 Apr-Jun 2016 19 19 Jul-Sep 2016 12 19 Oct-Dec 2016 10 19 Table 3. Number of triggered alerts required to identify the same number of officers who go on to have an adverse incident. Compares the SFPD EIS after the EIS Sergeant filtering and the DSAPP Simple Rules. Existing EIS program DSaPP - SR Jan-Mar 2016 78 133 Apr-Jun 2016 168 166 Jul-Sep 2016 149 106 Oct-Dec 2016 207 197 Image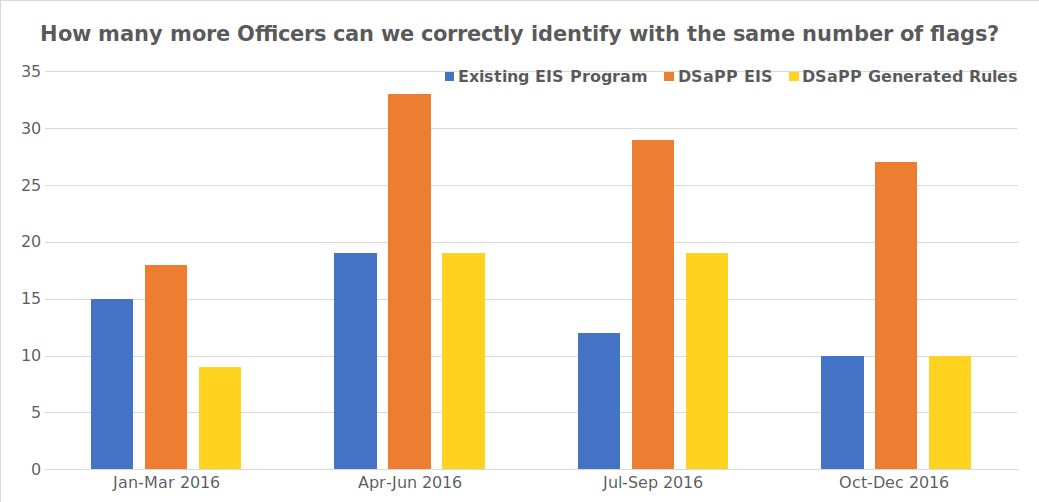 Image
Image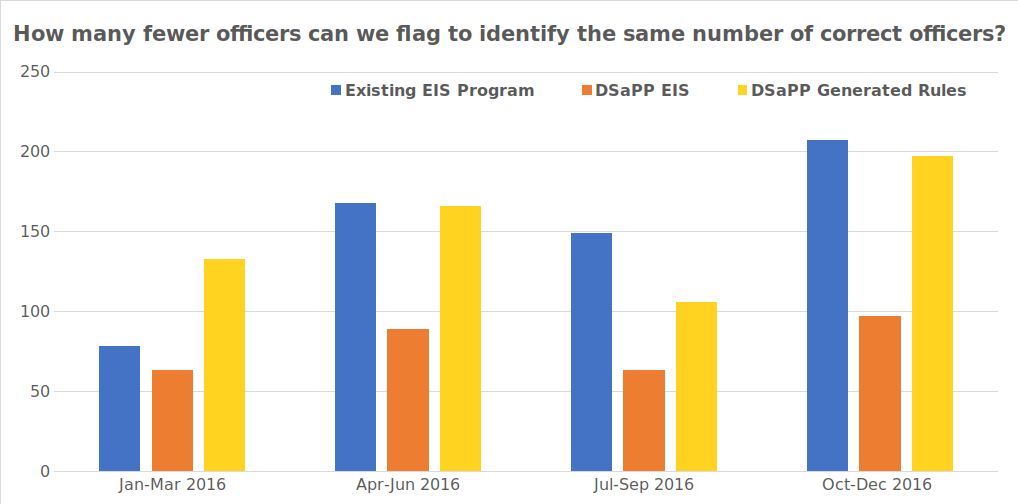 Image
Image
The yellow bar in the figures above shows the evaluation of that system, and as we can observe, the performance is comparable (and in some cases slightly better) to the existing SFPD EIS and significantly worse than the DSaPP data-driven EIS.
This analysis leads us to conclude that the reasons for the inaccuracies of the existing SFPD EIS are two-fold:
a. Lack of the system being data-driven.
b. The inherent limitations of a system being based on simple triggers and thresholds. Even adding data analysis capabilities to a threshold-based system doesn’t result in a significant improvement, leading us to conclude that threshold-based EISs are ineffective at identifying at-risk officers.
4.6 How can the data-driven system be improved?
Based on our review and work with data from SFPD and comparing that with the work we’ve done with other police departments, we believe that there is a data infrastructure gap that needs to be filled for SFPD. In our experience, the following data is ideal for building an effective data-driven EIS:- Data related to traffic stops, arrests, use of force, compliments, torts, dispatches, EIS alerts, IAS interventions, training for at least 4 years and all these data sets covering the same intervals of time. In the case of SFPD, we were provided some of this data for some of the time periods.
- The data should be collected for each officer and should be done at least daily. The ideal data records accurate timestamps, ideally to the minute at which an event happened, so we can order the events in a given day and detect events that lead ti future adverse incidents).
- The data related to traffic stops, arrests, use of force should include some geographic location, preferably the latitude/longitude of the event, but block, neighbourhood, zip code could also work. The SFPD data did not have geographical granularity.
- The linkage between different events and the officers involved in these events is critical. A traffic stop and/or dispatch leads needs to be linked to the arrest it leads to, and to the use of force incident that happened during that arrest, in order to build a chain of events and accurately detect future events connected to an individual officer.
- Any events captured in the data systems need to be linked to officer(s) involved in those events.
The major difference between SFPD and the departments we have worked with so far (such as CMPD and MNPD) is that in the latter two departments we were able to link all events that happen or that officers experience to the exact minute, date and geographical location. In our experience with the other departments, we observed that the occurrence and build up of specific stressful events an officer experiences (multiple responses to service to suicide calls or domestic violence calls) is predictive of possible adverse incidents by the officer in the future.
The events an officer is exposed to or activities each officers conducts every day have an impact on their behavior. In the case of the dispatch data provided to us from SFPD, we were only able to link the occurrence of an event to the month in which it happened, not the specific day or time. It is not possible with this data to differentiate the intensity of events and impression a specific officer is exposed to in a given time window - for other departments we were able to evaluate the number of certain types of calls each officer had responded to in the last day, week, two weeks, month, and so on. From anecdotal evidence from focus groups with officers and previous evaluation from other departments, there is a difference in future risk if an officer attends two suicide calls 3 weeks apart, or attends two within the same day.
- Despite the lack of available consistent, historical data, our prototype achieves similar efficiency while issuing fewer alerts than the existing EIS system (based on AIM + EIS Sergeant review). Based on the average number of alerts triggered in the first and second phase of the current SFPD EIS, we studied the performance of our data driven EIS at two points to match the number of alerts raised by the existing system: (a) generating alerts for the 50 highest risk officers every three months(DSaPP@50) and (b) generating alerts for the 25 highest risk officers every three months (DSaPP@25). Based on those alerts, we calculate the efficiency and coverage of the system DSaPP@50 if it had been operational from January 2015 to January 2017. We do not have EIS alert data from SFPD for 10 months in this window for March to December 2015. If we exclude 2015 from the evaluation of our prototype, DSaPP generates 250 alerts with 41 (16.4%) correct. The EIS Sergeant generated 658 alerts in the same period, of which 57 (8.6%) correctly identified officers that went on to have an adverse incident in the 12 months following the alert.This is 408 fewer alerts than the SFPD EIS, while only missing 16 of the alerts the SFPD EIS gets correct.5
- 5 Summary, Recommendations, and Next Steps
5.1 Summary
DSaPP has reviewed SFPD’s EIS Program, evaluated the efficiency and coverage of the EIS Sergeant’s alerts, built a prototype data-driven EIS, and compared its performance to that of the existing EIS program at SFPD. Despite numerous data issues and not having the benefit of the human review, we find that:- The existing SFPD EIS (combined decisions based on the threshold-based triggers and the Sergeant review) is highly inaccurate, with ~8% of flagged officers actually going on to have adverse incidents in the next year.
- This performance can be improved by using DSaPP’s data-driven EIS, as the evaluation shows 21% correct flags for the same time period as in #1. There is potential for even more improvement if the officer predictions from the system are then run through the same Sergeant review process as the existing EIS.
- The DSaPP EIS is flexible - it can flag the same number of officers as the current EIS and find more at-risk officers, or it can be used in a more focused manner to reduce the number of flags and find the same number of at-risk officers.
- The existing SFPD EIS and the DSaPP are not not only different in the percentage of correct flags but they also flag different types of officers. The existing EIS flags officers with high number of historical EIS Alerts and UOF incidents, and officers with more activity in general. The DSaPP EIS uses all the historical data to generate flags more accurately in a more nuanced manner, without relying purely on activity or historical EIS alerts.
- We find that the reasons for the inaccuracy of the existing SFPD EIS are two-fold:
- Lack of the system being data-driven
- The inherent limitations of a system based on simple trigger and thresholds.
- The review process, currently being performed by the EIS Sergeant, reduces the number of flags generated by the EIS program, but does not result in more efficiency. The same percentage of flags are correct, before and after the review process, leading us to believe that there is potential in improving this Sergeant review process.
5.2 Limitations and Caveats:
Our analysis has a few limitations and caveats that we lists here, primarily based on the data we received:
- The data has limited temporal and geographical granularity. For example, many of the events are aggregated at the month level, making it impossible to order events over time and detect predictors of future adverse incidents. Similarly, events not having a location hinders our ability to understand the context of an event and use it effectively.
- Limited ability to link events to officers. For example, dispatches not being linked to officers doesn’t allow us to correlate officers being dispatched to certain types of calls to their future risk of adverse incidents.
- Lack of closed IAD/OIS investigations for the last year of the data. Since IAD cases typically take around 12 months to finish, the latest reliable IAD data we have is from January 2017, making that the last time we can generate or evaluate our predictions.
5.3 Recommendations and Next Steps
- SFPD should explore the development and implementation of a data-driven EIS, similar to that of the DSaPP EIS to improve the effectiveness of the EIS program. We recommend taking the following steps to move forward:
- Work with DSaPP to evaluate the list of currently at-risk officers (this could only be generated as of Jan 2017 and is being provided as an attachment to this report).
- Design and conduct a pilot to validate the findings of the DSaPP prototype going forward.
- Have the EIS Sergeant review the data-driven alerts (Figure 12). Supervisors would likely receive more accurate alerts if SFPD used the data-driven EIS AND an EIS Sergeant review, which would help the department allocate its limited intervention resources to the officers who most need them.
Image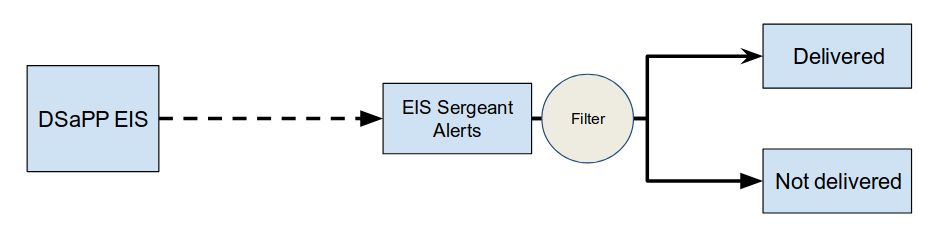
Fig 12. SFPD EIS proposed future state . This setup will take advantage of a Data-driven EIS plus the experience and knowledge of the users that will filter the wrong alerts. That filter could be added to the modeling phase in a feedback loop, in that way, the Data-driven EIS will learn from its mistakes. - Improve the data collection systems currently being used at SFPD in order to improve the EIS program, collecting more fine-grained data, capturing the entire EIS process as well as interventions instead of just the outcomes, and better data integration across different data systems in SFPD. The data-driven EIS cannot learn patterns it has no data for. We do not have some of the most useful data for SFPD to build an accurate system. For example, dispatches—such as dispatches to suicides and domestic violence calls involving children—are the strongest predictors in other departments, but the data we received lacks most of the required dispatch-officer links to create those variables. That information would not only increase the data-driven EIS’s accuracy; it would also provide more insight into the officer’s risk factors.
- Review the existing EIS Sergeant filtering and review process being used in the EIS program
- Explore methodologies to evaluate the effectiveness of existing interventions in order to determine appropriate interventions for individual officers, and improve the effectiveness of the EIS program. In addition, it would result in testing personalized interventions. Not all interventions work the same for all officers. The data-driven EIS can be used to help supervisors personalize interventions for each officer. With regular data updates, we can help SFPD develop a testing program.