Use of Force, July 2025 Report
Disclaimer:
The data presented in this report is based on information available at the time of preparation. All data is subject to change based on ongoing investigations or updates to reporting systems. This report is intended for public transparency and informational purposes only.
Overview
Total Use of Force Incidents | 80 |
|---|---|
Total Applications of Force Used | 154 |
Total Incidents of Firearm Drawing/Exhibiting | 158 |
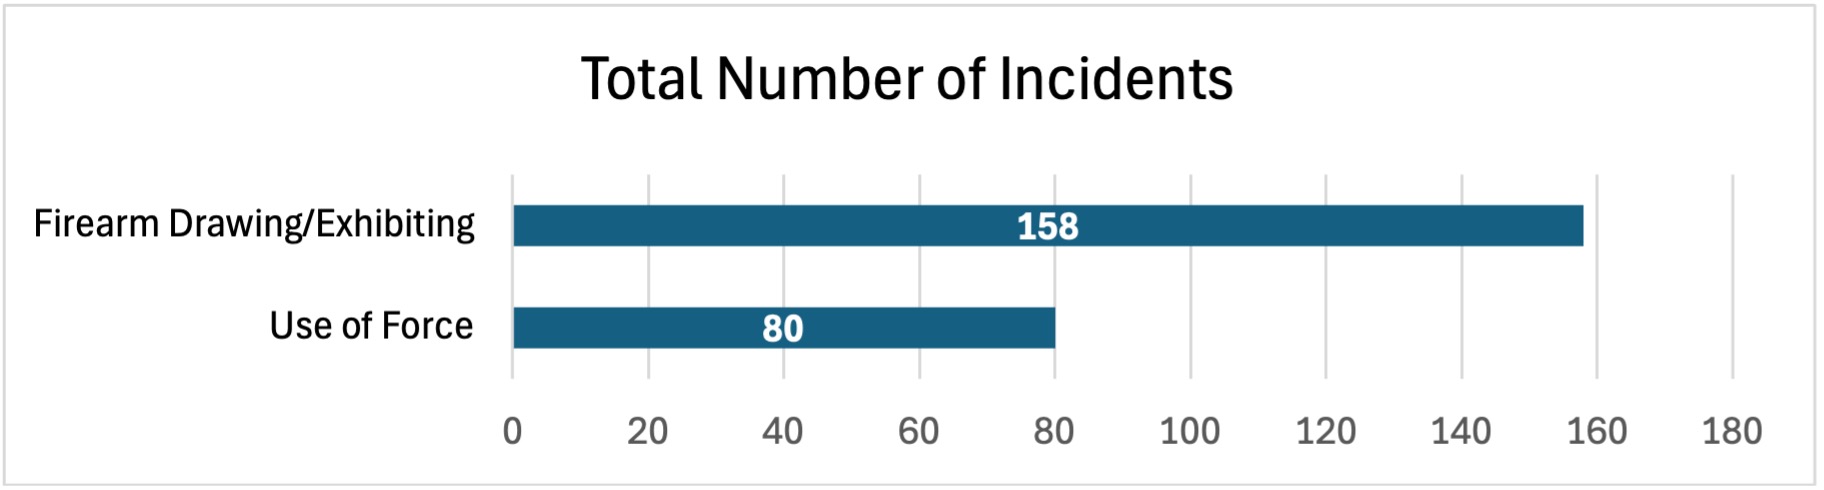
Total Number of Incidents
Firearm Drawing/Exhibiting | 158 |
|---|---|
Use of Force | 80 |
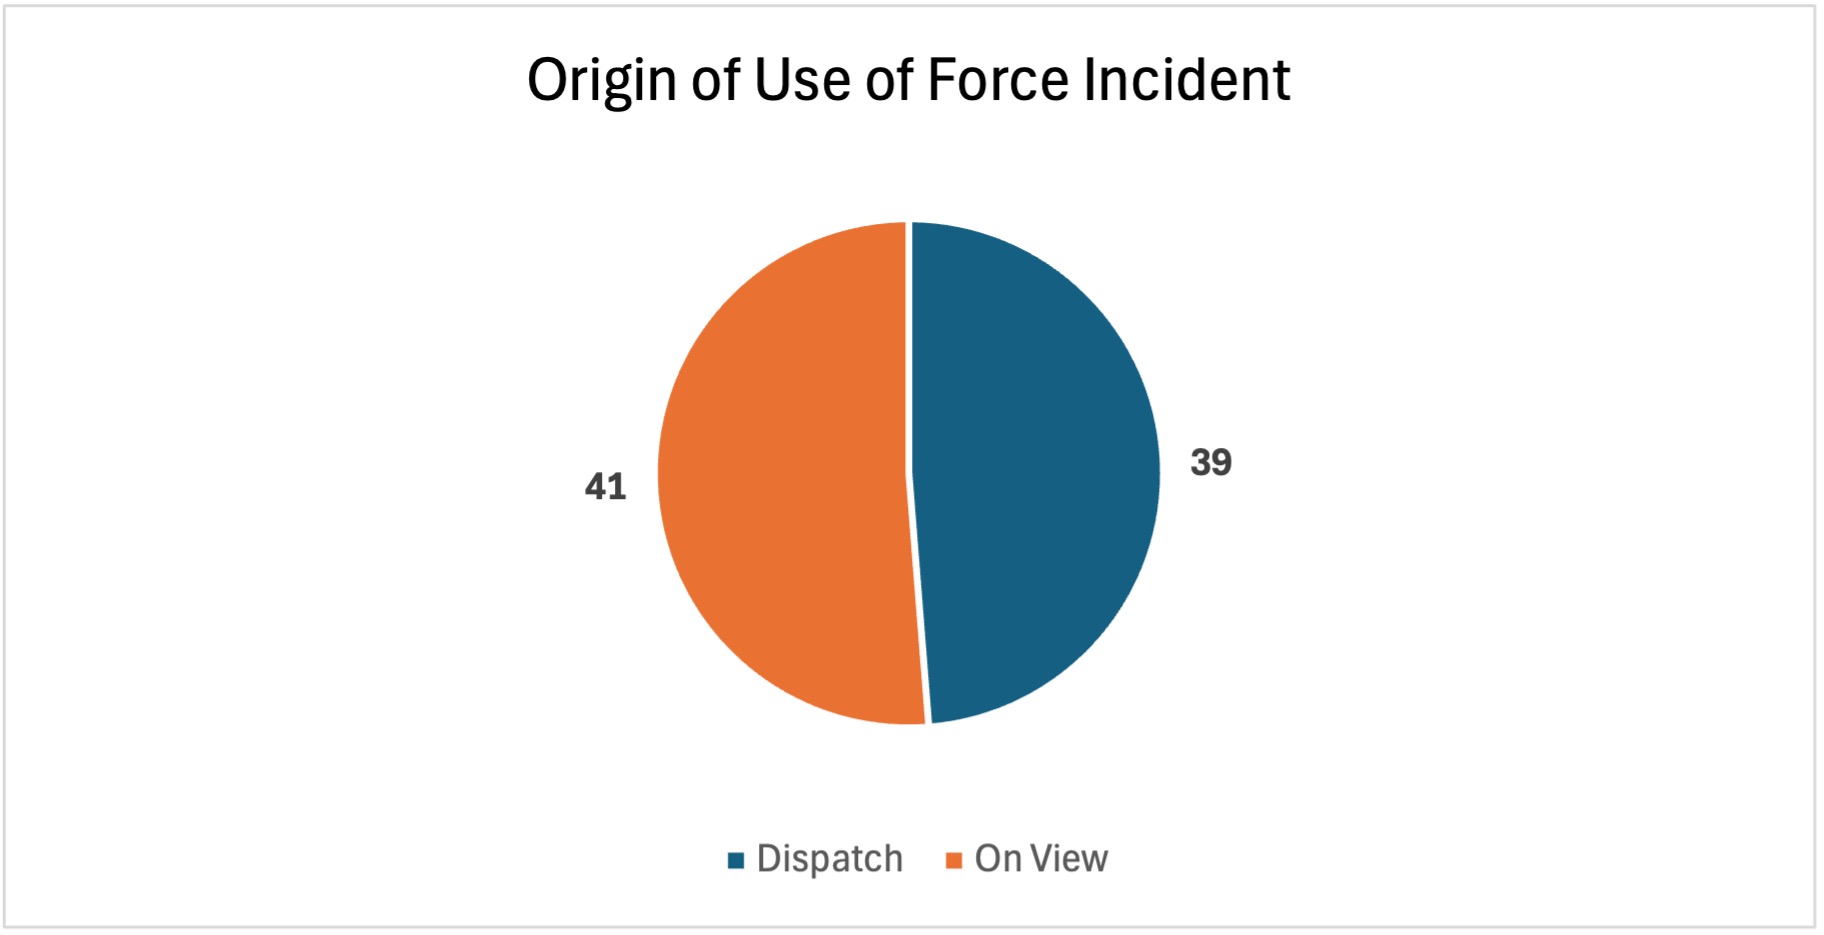
Origin of Use of Force Incident
Dispatch | 39 |
|---|---|
On View | 41 |
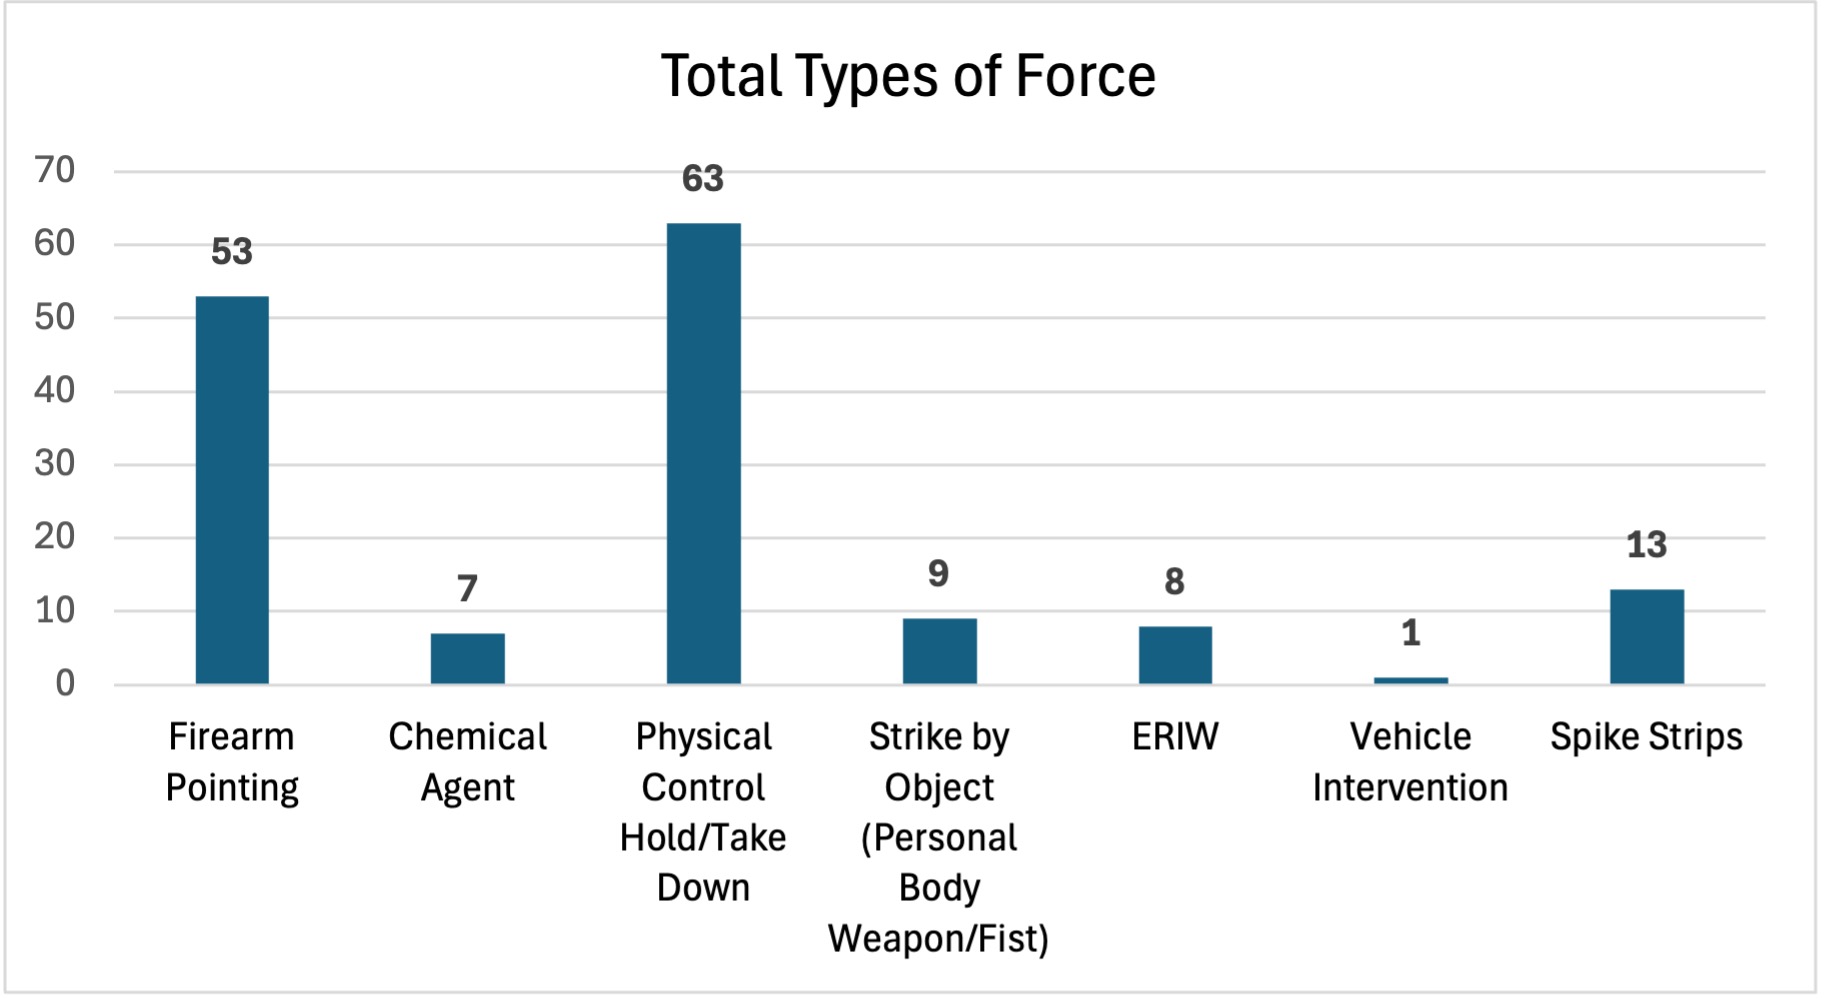
Total Types of Force
Firearm Pointing | 53 |
|---|---|
Chemical Agent | 7 |
Physical Control Hold/Take Down | 63 |
Strike by Object (Personal Body Weapon/Fist) | 9 |
ERIW | 8 |
Vehicle Intervention | 1 |
Spike Strips | 13 |
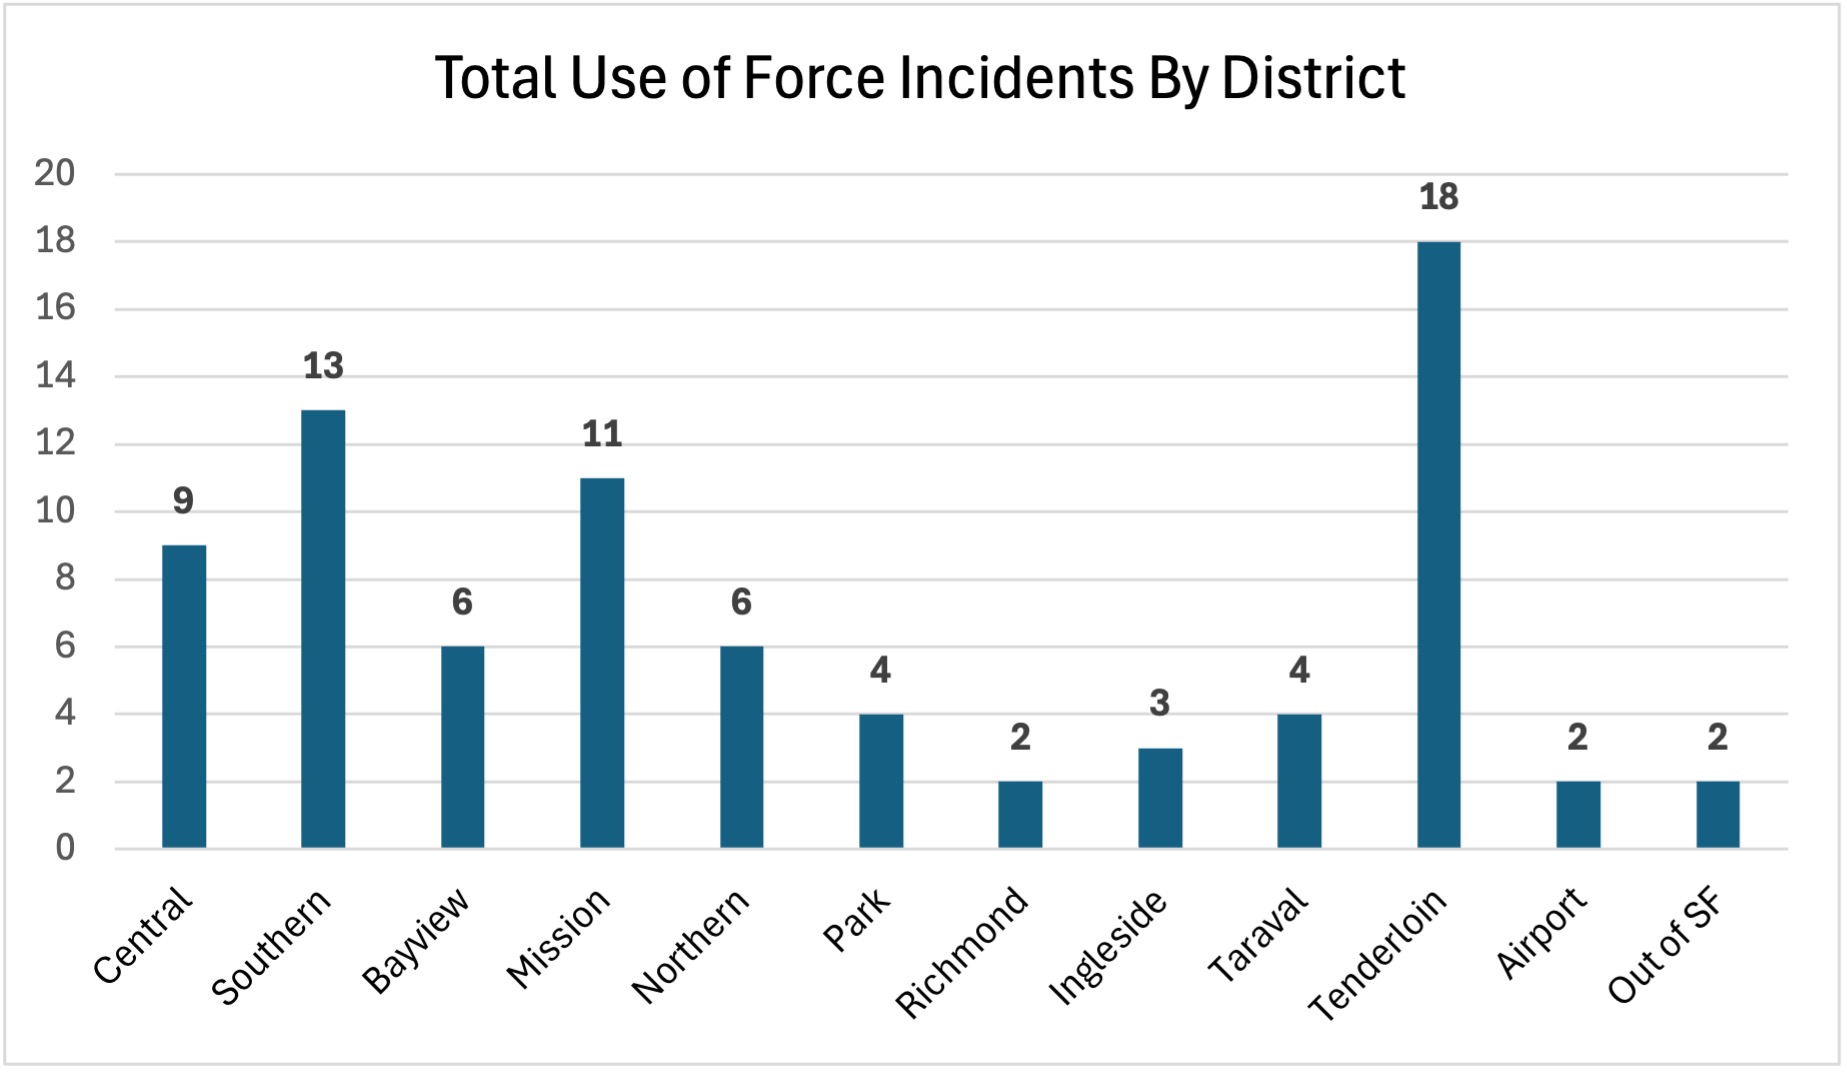
Total Use of Force of Incidents by District
Central | 9 |
|---|---|
Southern | 13 |
Bayview | 6 |
Mission | 11 |
Northern | 6 |
Park | 4 |
Richmond | 2 |
Ingleside | 3 |
Taraval | 4 |
Tenderloin | 18 |
Airport | 2 |
Out of SF | 2 |
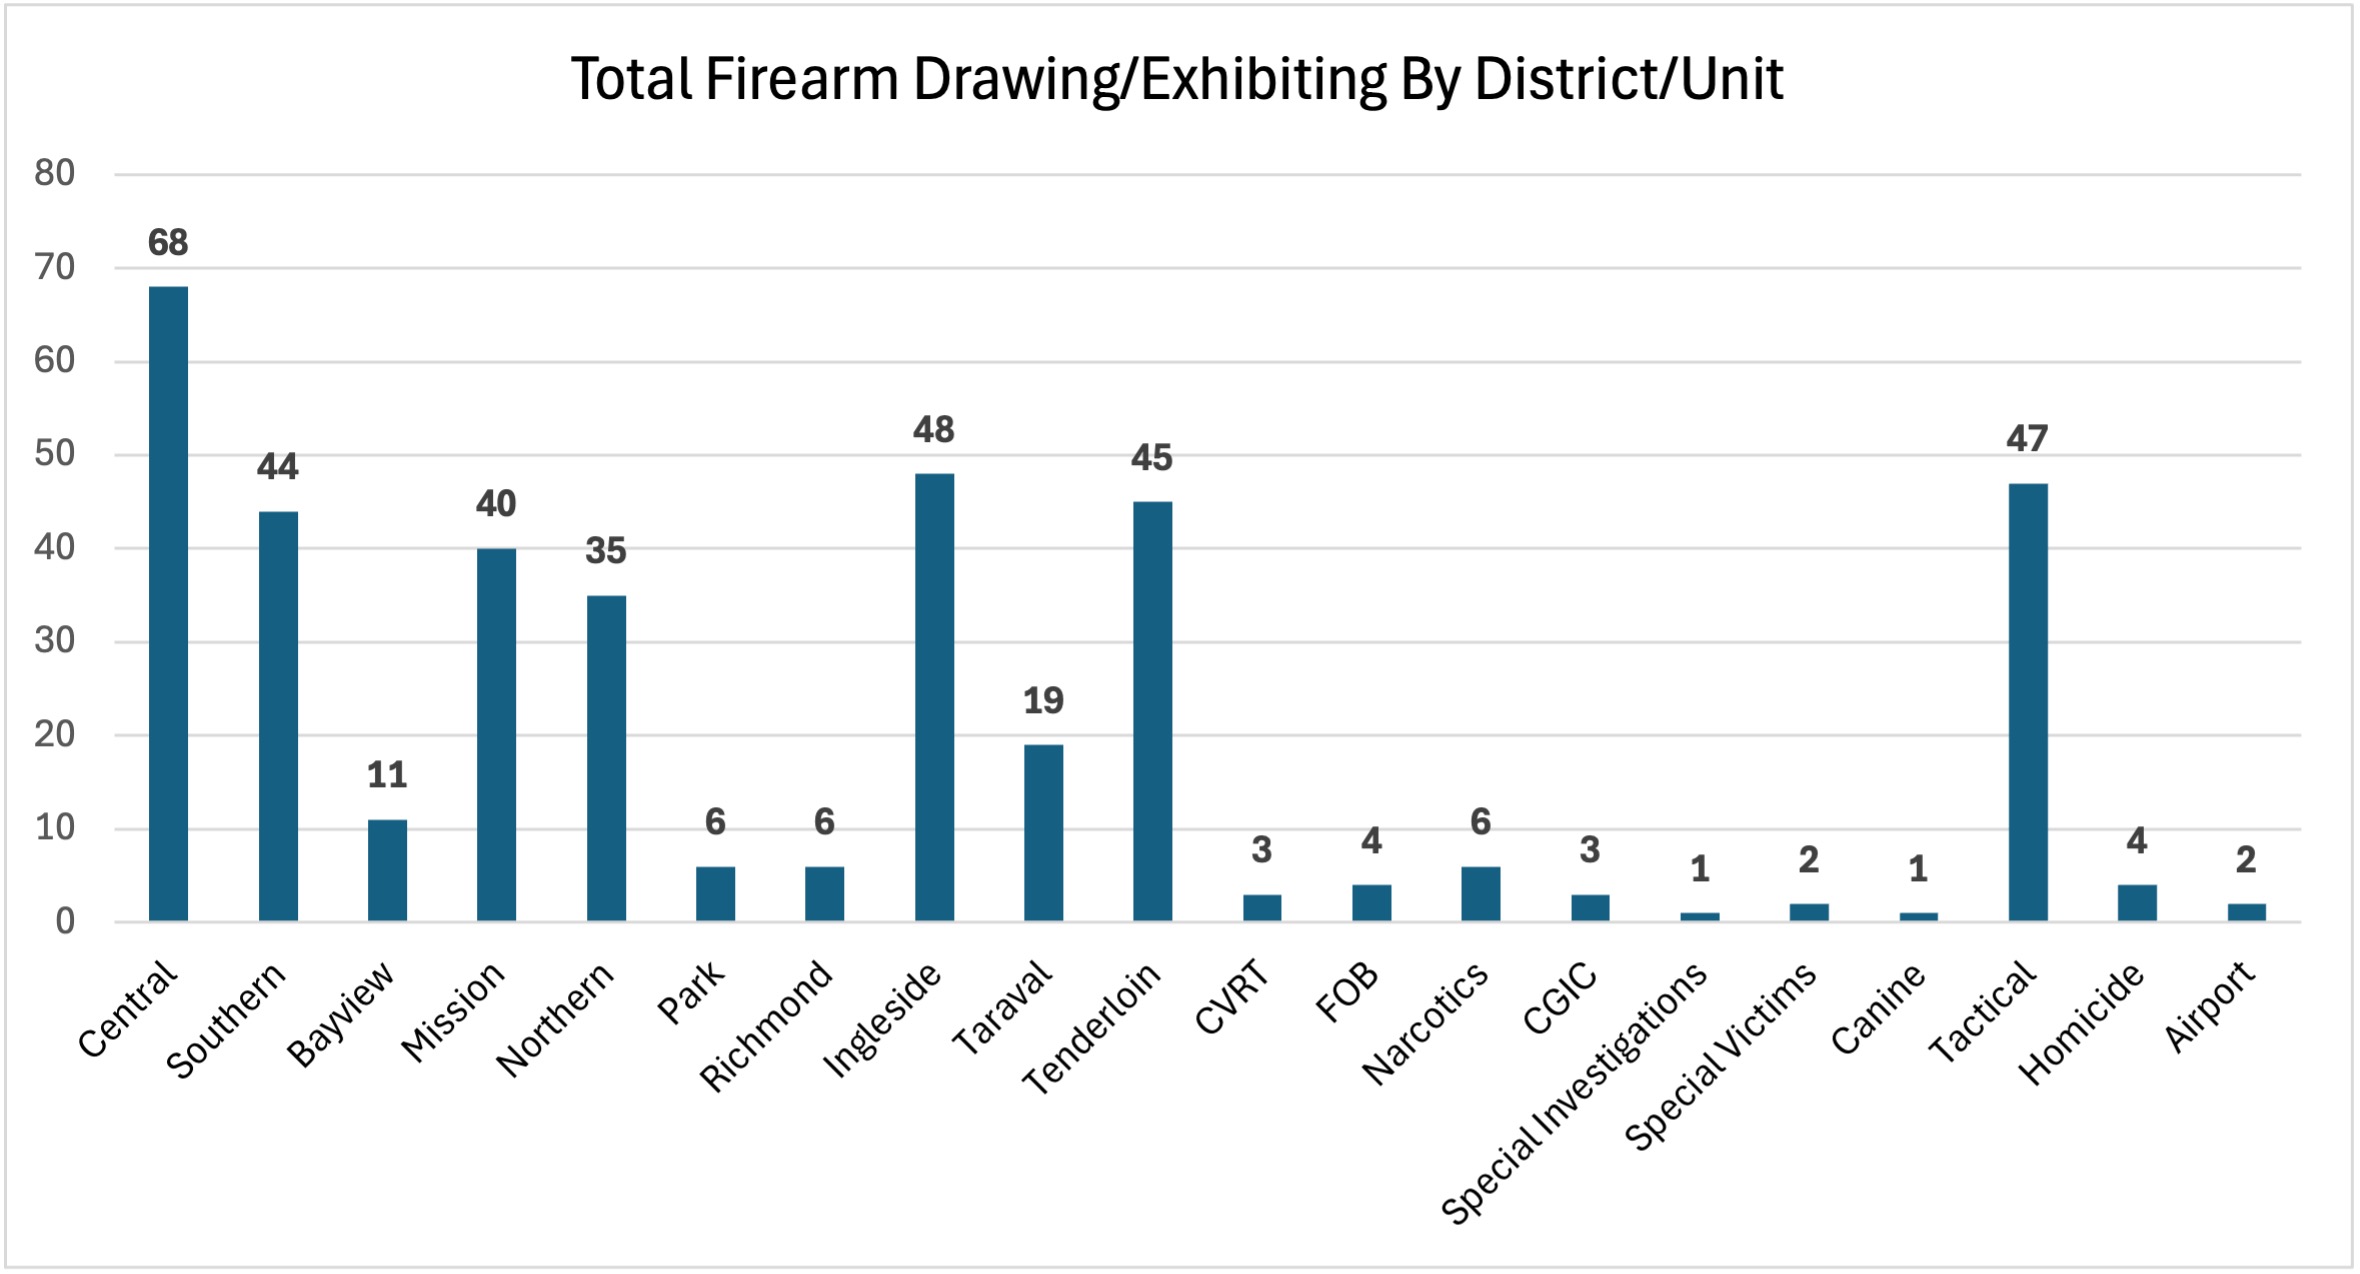
Total Firearm Drawing/Exhibiting Incidents by District/Unit
Central | 68 |
|---|---|
Southern | 44 |
Bayview | 11 |
Mission | 40 |
Northern | 35 |
Park | 6 |
Richmond | 6 |
Ingleside | 48 |
Taraval | 19 |
Tenderloin | 45 |
CVRT | 3 |
FOB | 4 |
Narcotics | 6 |
CGIC | 3 |
Special Investigations | 1 |
Special Victims | 2 |
Canine | 1 |
Tactical | 47 |
Homicide | 4 |
| Airport | 2 |
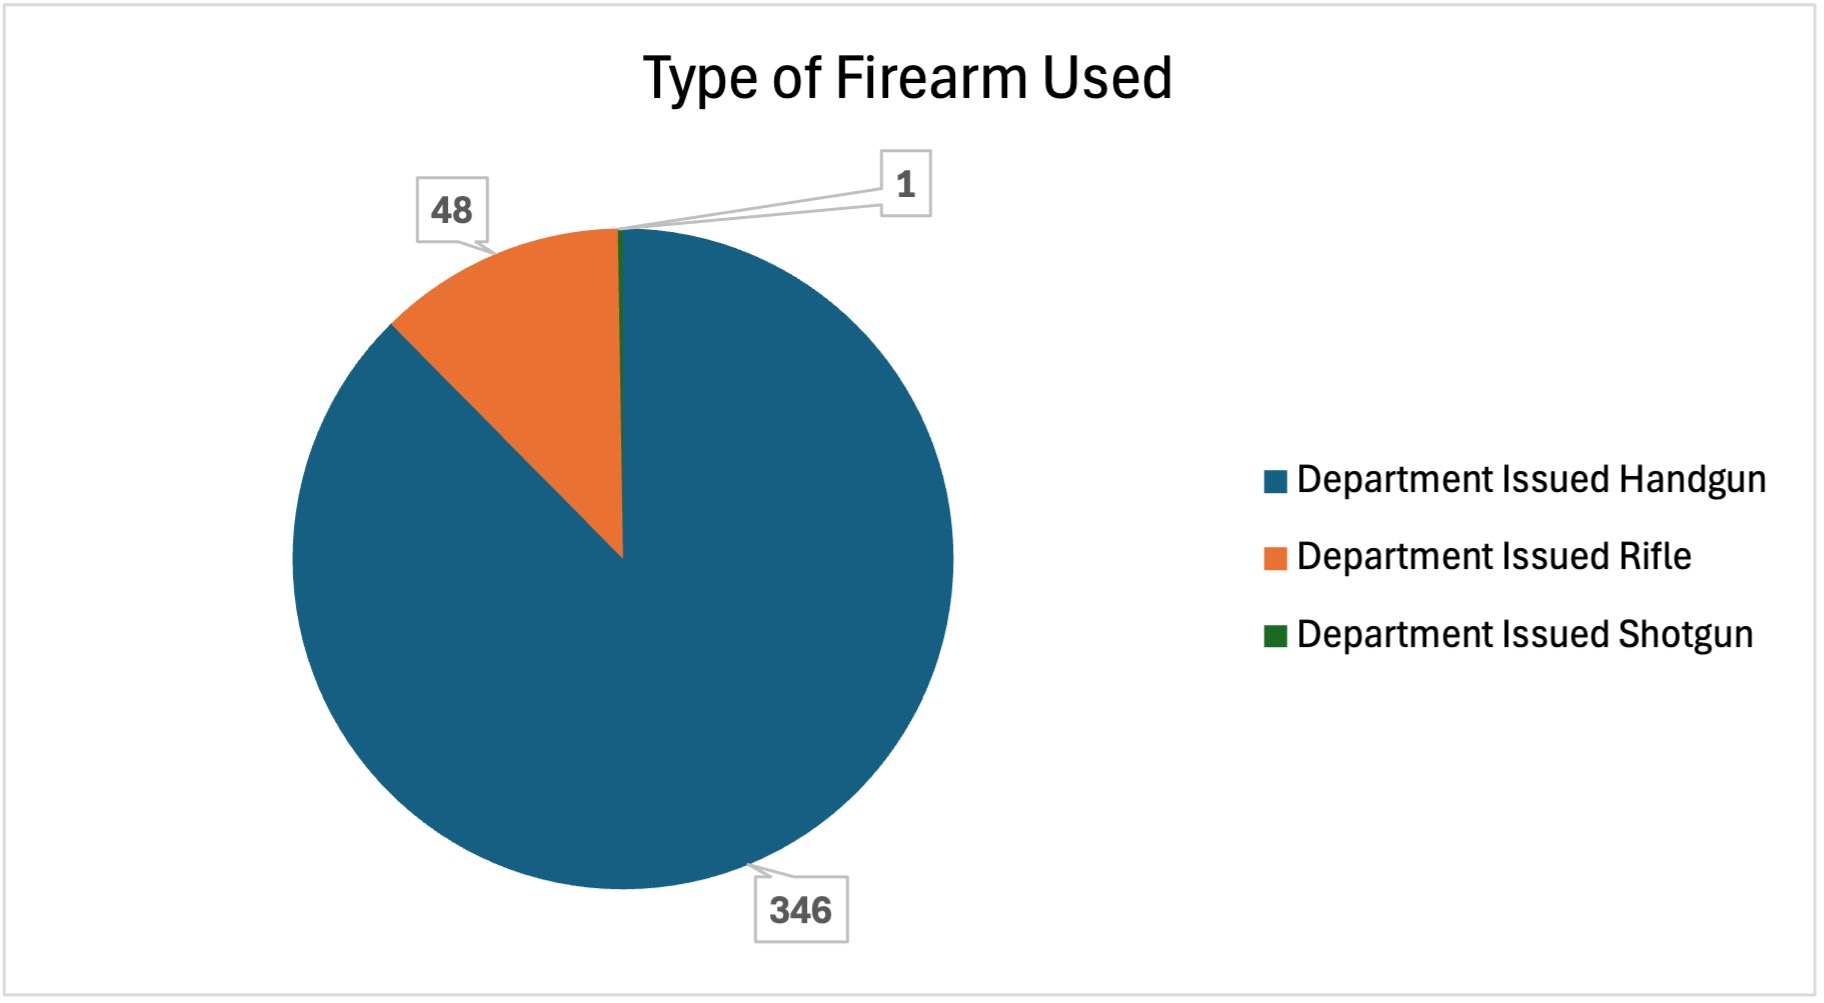
Type of Firearm Used
Department Issued Handgun | 346 |
|---|---|
Department Issued Rifle | 48 |
Department Issued Shotgun | 1 |